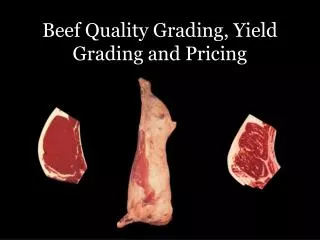
BEEF QUALITY and YIELD GRADES
460 likes | 870 Vues
Learn the differences between beef grading and inspection, including the classes of beef carcasses, palatability attributes, USDA quality grades, and factors determining quality and yield grades. Explore the relationship between marbling, maturity, and carcass quality to make informed decisions on beef selection and breeding.

BEEF QUALITY and YIELD GRADES
E N D
Presentation Transcript
Meat Inspection & Grading • What’s the difference? To simplify: • For meat inspection, think wholesomeness • For grading, think quality
Grading • Value – Quality and Yield • USDA Agricultural Marketing Service • Grader • Voluntary • Packer pays per hour Inspection • Wholesomeness • USDA Food Safety & Inspection Service • Veterinarian • Mandatory • Taxpayer funded
Sex Classes of Beef Carcasses • Heifer • Steer • Cow • Bullock • Bull
Palatability Attributes • Tenderness • Flavor • Juiciness
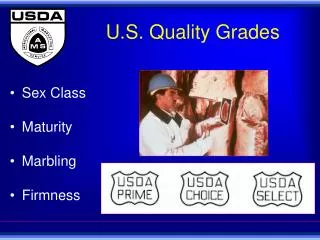
USDA Quality Grades • Grades of youthful carcasses (< 30 mos.) Prime Choice Select Standard • Grades of mature carcasses (> 42 mos.) Commercial Utility Cutter Canner
USDA Quality Grades Based on consideration of two general factors: • Physiological maturity • Skeletal • Lean • Marbling (intramuscular fat) • Amount • Distribution
USDA BEEF GRADES Maturity Groups A B C D E
Physiological Maturity vs Chronological Maturity • Physiological maturity of the carcass is an estimate of the actual chronological age of the animal USDA Maturity Score Estimated chronological age A 9 to 30 months B 30 to 42 months C 42 to 72 months D 72 to 96 months E 96 or more months
Shear Force Values Relationship Between Tenderness and USDA Maturity Scores
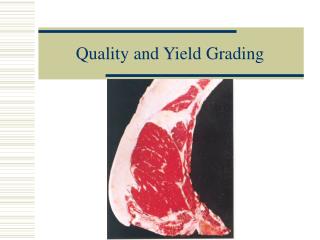
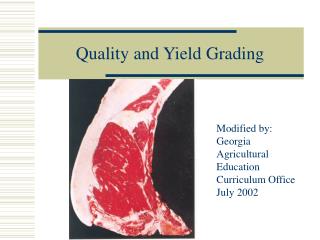
USDA BEEF GRADES Marbling • Fat within the muscle (Intramuscular fat) • Evaluated in the ribeye between the 12th-13th ribs
Marbling Slight Modest Small ModeratelyAbundant Moderate Slightly Abundant
Relationship Between Marbling, Maturity, and Carcass Quality Grade1 Maturity2 A3 B C D E Slightly Abundant Moderate Modest Small Slight Traces Practically Devoid 1Assumes that firmness of lean is developed with the degree of marbling and that the carcass is not a “dark cutter.” 2Maturity increases from the left to right (A through E). 3The A maturity portion of the figure is the only portion applicable to bullock carcasses.
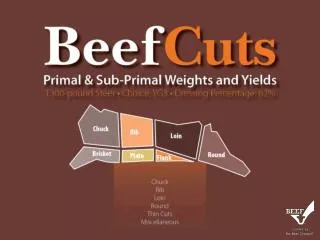
Yield Grade • Indicate carcass cutability • Yield of boneless, closely trimmed retail cuts from round, loin, rib, and chuck
USDA BEEF GRADES Yield Grade Factors • Thickness of fat over the ribeye • Ribeye area • Percent kidney, heart, and pelvic fat • Hot carcass weight
USDA BEEF GRADES Fat Thickness (12th rib--adjusted)
USDA BEEF GRADES Preliminary Yield Grade PYG FAT 2.0 0.00 2.5 0.20 3.0 0.40 3.5 0.60 4.0 0.80 4.5 1.00
USDA BEEF GRADES Ribeye Area
USDA BEEF GRADES REA/HCW Schedule HCW REA HCW REA 50009.8 700 12.2 525 10.1 725 12.5 550 10.4 750 12.8 575 10.7 775 13.1 600 11.0 800 13.4 625 11.3 825 13.7 650 11.6 850 14.0 675 11.9 875 14.3
USDA BEEF GRADES REA/HCW Schedule HCW REA 500 9.8 600 11.0 700 12.2 800 13.4 +/- 3.0 Sq In = +/- 1.0 YG
USDA BEEF GRADES KPH Fat
USDA YG %BCTRC 52.3 % or more 52.3 - 50.0% 50.0 - 47.7% 47.7 - 45.4% 45.4% or l-ess 1 2 3 4 5 USDA Yield Grade % BCTRC (Boneless closely trimmed retail cuts) = 51.34 – 5.784(Adj.Fat) – 0.462(KPH) + 0.740(REA) – 0.0093(HCW) USDA YG = 2.5 + 2.5(Adj.Fat) + 0.2(KPH) - 0.32(REA) + 0.0038(HCW)
TRIMMER BEEF Leanness Taste appeal Consumer Acceptability
CH $141.68/cwt SE $132.39/cwt YG & QG Dressing 64% $87/cwt $135.94/cwt Slaughter Fab/Processing Credit items: Fat: $15/cwt Bone: $3/cwt By-Products ($/cwt) ($8.22)/live cwt Dressing Percentage: Hot Carcass Weight, lb x 100 Live Weight, lb
By-Products ($/cwt) ($8.22)/live cwt CH $141.68/cwt SE $132.39/cwt YG & QG $135.94/cwt $87/cwt Slaughter Fab/Processing Credit Items Fat $15/cwt Bone $3/cwt Meat industry focuses on dressing % and red meat yield Live Wt Carcass Wt Boxed Wt 1250 800 416 %BCTRC 52% Dressing % = 64%
Carcass Price Grid Yield Grade
Informational Web Sites Beef Grading www.ams.usda.gov/lsg/mgc/beefrole.htm Food Safety and Inspection Service www.fsis.usda.gov The Role of USDA’s Beef Grading Program in the Marketing of Beef http://www.ams.usda.gov/lsg/mgc/mgc-pubs.htm OSU Meat Science home pagehttp://www.ansi.okstate.edu/meats/