Download

1 / 14
140 likes | 267 Vues
This text explores the components of the market system, focusing on demand and supply dynamics. It defines demand as the consumer's desire to purchase goods at various prices, highlighting the significance of effective demand. The text explains the demand curve's downward slope, indicating that higher prices lead to lower demand. Additionally, it explores factors influencing both demand and supply, including price, income, tastes, and production costs. The implications of shifts in demand and supply curves in response to changing factors are also discussed, providing insight into market price determination.

E N D
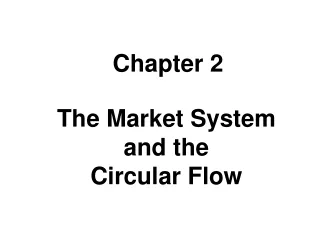
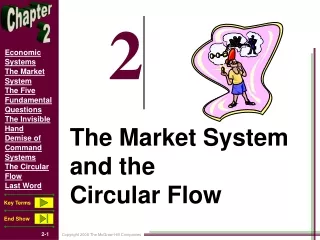
The Market System Demand, Supply and Price Determination
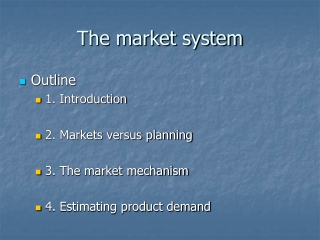
The Market System • Market consists of: • Consumers: create a demand for a product. • Demand • the amount consumers desire to purchase at various prices • Not what they will buy, but what they would like to buy! • Effective demand – must be willing AND able to pay
Individual and Market demand • Market demand – consists of the sum of all individual demand schedules in the market • Represented by a demand curve • At higher prices, consumers generally willing to purchase less than at lower prices • Demand Curve – negative slope, downward sloping from left to right
The Demand Curve Price (£) £10 £5 Demand 100 150 Quantity Demanded (000s)
The Demand Curve 2 • The level of demand – • determines where on the graph it sits • Low demand – • nearer the origin • High demand – • further from the origin (assuming same scale) • Dependent on a variety of factors • Demand Curve moves in response to changing factors
The Demand Curve 3 • Factors influencing Demand D = f (Pn,Pn…Pn-1, Y, T, P, A, E) • Where: • Pn = Price • Pn…Pn-1 = Prices of Other Goods – Substitutes and Complements • Y = Incomes – the level and distribution of income • T = Tastes and fashions • P = the level and structure of the population • A = Advertising • E = Expectations of Consumers
The Demand Curve 4 Changes in any of the factors other than price causes the demand curve to shift either: • Left (less demanded at each price) or • Right – (More demanded at each price)
The Demand Curve 5 Price (£) £10 D1 Demand D2 10 100 200 Quantity Demanded (000s)
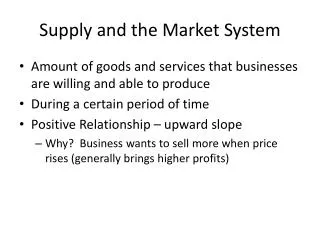
The Supply Curve • Factors Influencing Supply: • S = f (Pn, Pn..Pn-1,H, N,F1..Fm,E,Sp) • Where: • Pn = Price • Pn..Pn-1 = Profitability of other goods in production and prices of goods in joint supply • H = Technology • N = Natural shocks • F1..Fm – Costs of production • E = expectations of producers • Sp = Social Factors
The Supply Curve • Changes in any of the factors OTHER than price cause a shift in the supply curve • A shift in supply to the left – the amount producers offer for sale at every price will be less. • A shift in supply to the right – the amount producers wish to sell at every price increases • HINT: Be careful to not confuse supply going ‘up’ and ‘down’ with the direction of the shift!
The Supply Curve Price £ Supply £7 £3 800 200 Quantity Bought and Sold (000s)
The Supply Curve Price £ S1 Supply S2 £4 100 400 900 Quantity Bought and Sold (000s)
The Market S Price (£) Surplus £5 £3 D1 D 300 600 450 Quantity Bought and Sold (000s)
The Market S1 S Price (£) £8 £5 Shortage D 100 600 350 Quantity Bought and Sold (000s)