
Gene Set Enrichment Analysis of Cardiac Expression Profiles in WT Mice Post Myocardial Depression
This study presents the gene set enrichment analysis (GSEA) of cardiac expression profiles from wild-type (WT) mice following CLP-induced myocardial depression. Three plots illustrate significant changes in fatty acid metabolism, mitochondrial function, and oxidative phosphorylation genes. The top section of each plot details the enrichment score (ES) progression, the middle section lists key genes identified as “hits,” and the bottom displays a histogram of overall gene rankings. Additionally, heat maps depict expression values for the top genes in each pathway, with red indicating high expression and blue low.

Gene Set Enrichment Analysis of Cardiac Expression Profiles in WT Mice Post Myocardial Depression
E N D
Presentation Transcript
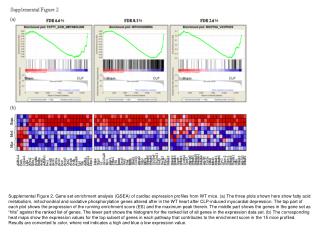
Supplemental Figure 2. Gene set enrichment analysis (GSEA) of cardiac expression profiles from WT mice. (a) The three plots shown here show fatty acid metabolism, mitochondrial and oxidative phosphorylation genes altered after in the WT heart after CLP-induced myocardial depression. The top part of each plot shows the progression of the running enrichment score (ES) and the maximum peak therein. The middle part shows the genes in the gene set as “hits” against the ranked list of genes. The lower part shows the histogram for the ranked list of all genes in the expression data set. (b) The corresponding heat maps show the expression values for the top subset of genes in each pathway that contributes to the enrichment score in the 15 mice profiled. Results are converted to color, where red indicates a high and blue a low expression value.