Download
1 / 30
300 likes | 527 Vues
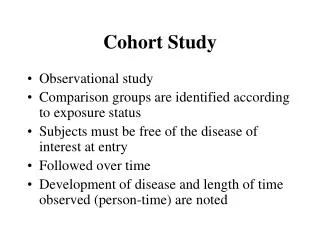
Progression and Attrition Rate: Overview of Undergraduate and Masters Cohort Study. T Zewotir , D North and M Murray School of Statistics and Actuarial Science, UKZN. Introduction. University is open only to a fraction of the young talented citizens.

E N D
Progression and Attrition Rate: Overview of Undergraduate and Masters Cohort Study T Zewotir, D North and M Murray School of Statistics and Actuarial Science, UKZN
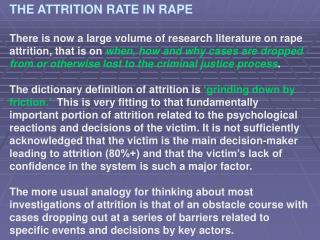
Introduction • University is open only to a fraction of the young talented citizens. • Problem: not all of this group successfully goes through the university system of education. Attrition rate: the proportion of students who discontinue their studies on account of academic dismissal or voluntary dropout.
Why do we study attrition rate? • Relevant issue for the assessment of the overall learning environment and its operational efficiency. • The magnitude of attrition rate reflects selection procedures and/or social and academic integration and/or the quality of instructional process. • Key element for planners and administrators to predict the number of possible admissions and throughputs.
Part I • Undergraduate students progression rate
Dampening effect • There is a dampening effect of the rates of attrition as the students progress from year/semester to year/semester. • students entering at a later year have completed more prerequisites. • Students are generally acquainted with the environment.
Layout: Suppose a program requires K semesters/years of study.
Statistical Problem: Modelling the progression of the cohort. Estimating the initial attrition rate and the dampening (or progression) rate. Criteria: KISS Dampening effect parameter, β, is close to 0 the attrition rate is the same as in the initial attrition throughout the K semesters/years. Dampening effect parameter, β,far from 0 negative showing the decaying of the attrition rate and positive indicating that the attrition rate gets worse as the students progress.
Demonstration:Initial attrition rate=0.40 and K=5 Log/exponential type: Fast dampening effect β=-0.10, exp(-0.10)=0.904 (9.6%): 0.400, 0.362, 0.327, 0.296, 0.267; β=-0.50, exp(-0.50)=0.607(39.3%): 0.400, 0.243, 0.147, 0.089,0.054; β=-1.00, exp(-1.00)=0.368 (63.2%): 0.400, 0.147, 0.054, 0.019, 0.007. Logit type: Slow dampening effect β=-0.10, exp(-0.10)=0.904 =OR: 0.400, 0.372, 0.353 0.330, 0.308; β=-0.50, exp(-0.50)=0.607=OR: 0.400, 0.288, 0.197, 0.130, 0.083; β=-1.00, exp(-1.00)=0.368 =OR: 0.400, 0.197, 0.083, 0.032, 0.012.
More than one dampening effect • A constant dampening effect over the K years/semesters may not be a proper assumption. • For example wish to model an attrition rate that slows down after semester/year 2. Here we have two dampening effects.
Interest • Developing the best fitting model. Thereby answer the following: • Do the faculties have identical initial attrition rate? • Is there identical dampening effect as the students progress? • Is the initial attrition rate stable within the faculty?
Result • The initial attrition rates differ between the faculties (2=132.12 and p<0.0001). • The dampening effect from first year to second year, the dampening effect differs from faculty to faculty (2=1303.67 and p<0.0001).
... Result... • The progression/dampening rate after year 2 showed that all the faculties have different dampening effect (2=110.21 and p<0.0001). • All the faculties have different dampening/progression rate from second to third year. • Unlike others, in the Faculty of Management the attrition rate appreciates after year 2.
...result • Since 2005 the first year attrition rate shows a decreasing linear trend in all the faculties. • The decreasing rate in Science is significantly higher than that of Management and Humanities. • The decreasing rate difference between Humanities and Management is insignificant (t= -0.360, p= 0.5343).
Part II • Masters students time-to-degree Note: Only Research Masters
Why do we study the Masters level throughput? • It is crucial to meet the demands of high level skills . • It is important to assess the overall learning and research environment and its operational efficiency of the university. • Research on Masters throughput is motivated by economic and psychosocial costs of Masters attrition.
What are we going to examine? • The Masters entrants and graduates by demographic characteristics. • The success/failure rate of Masters students in a given cohort. • The time-to-degree for Masters students in different faculties.
The Data • Cohort of the Masters program intake at UKZN. • The Performance of the 2004, 2005, …, 2010 cohorts of Masters program entrants is tracked. • The demographic and academic characteristics of these students were extracted from the University database.
Percentage of successful full-time students by duration and admission year
Successful full-time students average time-to-degree by Faculty
Summary • The admission rate of Masters degree students is increasing every year by about 6.6%. • Race and gender differences on the success rate are not significant. • Completing a full-time Masters in one year, although not impossible, it is not practically achievable by more than 95% of the students.