The Balance Sheet
160 likes | 297 Vues
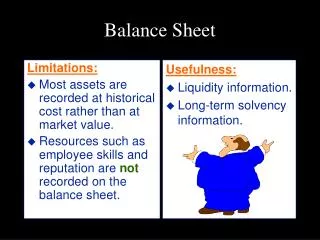
A balance sheet is an essential tool for assessing financial health. It provides a snapshot of your assets and liabilities, revealing your net worth. By listing your assets on the left side and liabilities on the right, you can compute your net worth (A - L). Assets include cash, real estate, and investments, while liabilities encompass debts like mortgages and loans. Understanding your balance sheet helps you plan for financial goals and maintain solvency. Monitor your net worth over time to gauge your financial progress and make informed decisions.

The Balance Sheet
E N D
Presentation Transcript
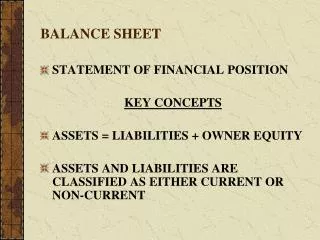
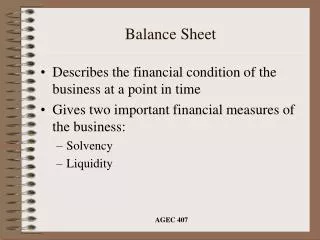
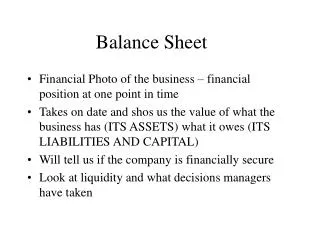
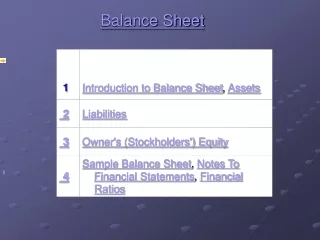
As we think about our financial goals, we may want to make plans so we can get where we want to go. A useful tool in this process is the balance sheet. A balance sheet is a statement about where we are now. To get where we want to go it can be good to do an inventory of where we currently are. On a personal balance sheet we take an inventory at a point in time of our assets and liabilities and on the sheet we have a computed item called net worth that equals our assets minus our liabilities.
Here is the basic look of a balance sheet in a table. We have assets on the left and liabilities and net worth on the right. Remember, If we just stop at a certain point in time and do an inventory on these items we would have a statement of where we are with our financial life. Assets Liabilities NW = A - L Next, let’s lists and define some typical assets and liabilities.
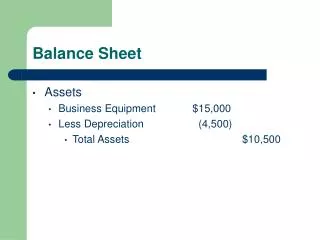
Assets In general, assets are the things we own. We may not have fully paid for them yet, but then we would be making payments on the asset. Note leased items are not assets. In personal finance we list assets at their current fair market value. This is the price we could reasonably expect to sell the item for in the open market. Liquid assets Liquid assets include cash, checking accounts, saving accounts, money market accounts and cd’s and the like that mature in 1 year or less. The point is these assets are cash or can be made cash with little or no loss in value.
Liquidity Liquidity refers to how quick assets can be transformed into cash and the value of the assets suffers little or no loss in value. Cash is in fact the most liquid asset. Checking and savings accounts are fairly liquid in that you just go to the bank or atm to get the cash. Remember though, when you opened the account you signed a card that said something like the bank reserves the right to hold your funds for a while. Doesn’t usually happen but it can. Land, or real estate or stocks are less liquid because it may take time to get the value out of the assets without loss. It takes time to find buyers, for example.
Investments These are the financial assets we acquire for long term purposes. These are the stocks and bonds we acquire from corporations and governments. Plus we would include our insurance plans and the like. Real Property refers to immovable property like land and our house. Personal property includes our cars, jewels, clothes, artwork and other stuff we own. The authors suggest that personal property items depreciate, or decline in value, soon after we buy them. So, we have listed four major categories of assets.
Liabilities Liabilities represent our debts. In general, liabilities can be categorized two ways: 1) Current, or short term, liabilities are any debts with final payments due within one year of the date of the balance sheet. 1) Long term liabilities are any debts with final payments due more than one year of the date of the balance sheet. Current liabilities include credit card balances that require monthly payoffs (like Amer Ex) or bills that you have for services rendered and are due shortly. This would include utility bills and the like already received. The more familiar long term debt items include home mortgages, installment loans and car loans. Only the latest outstanding balance should be listed and don’t include the interest payments you will make over the years. The balance would represent a payoff amount now.
Net Worth The balance sheet gets its name from the notion that the left side and the right side should balance. This doesn’t necessarily mean that A = L. Added to the right side of the sheet is the equity, or net worth, of the individual. The net worth is a residual and equals A – L. So NW = A – L is often called the balance sheet equation. If NW > 0 we saw WOW, that person is wealthy, and if NW = 0 we say double WOW, that person has perfect balance (probably not very common), and If NW < 0 we say bummer, that person is technically insolvent. This means the assets have fair market value less than the debt still owed on the assets.
Median, or 50th percentile, means that half the folks have more and half have less. $ age In the graph the line represents the median net worth at various ages. So, as folks get older the median net worth rises. Plus the rise is quick early on and then the rise tends to rise more slowly.
The Solvency Ratio The solvency ratio is total net worth or total assets minus total liabilities total assets total assets For you fans of algebra this means the ratio can be written 1 – (L/A). Let’s call the ratio sr for short. Now if NW > 0, then A > L and thus sr < 1, but if NW = 0, then A = L and thus sr = 0, and if NW < 0, then A < L and thus sr < 0.
So, the solvency ratio is a number less than one. It can actually equal one in the case where there are assets but liabilities equal zero. The larger liabilities are relative to assets, the closer a person is to insolvency and the closer sr is to being negative. $ liabilities assets sr values 1 0 < 1 but > 0 < 0
Example A = 100,000 and L = 50,000. Thus NW = 100,000 – 50,000 and sr = 1 – (50,000/100,000) = .5 Remember that assets are listed at fair market value. Liabilities are usually agreed upon and can not change in value (unless you break the agreement and declare bankruptcy). Say the asset values, though, take a tumble (stock portfolio falls, real estate is revealed to be in a bad location, like on top of hazardous material – whatever). The sr ratio will move toward zero,or even become negative. When seen as a percentage the solvency ratio shows how much the market value of the assets can decline before the person is insolvent.
The solvency ratio is an indicator of ability to withstand financial problems. The liquidity ratio shows the percentage of the short term liabilities that can be covered by the liquid assets. Thus, if the person were to lose their job they would have to use current assets to pay off debt. The liquidity ratio is (let’s call it lr) lr = liquid assets/total current debt This ratio can never be less than 0. The closer it is to zero the more we would say the person has liquidity problems. So if their income would tumble they could have trouble meeting their current liabilities – remember, things like utility bills and credit card payments.
Digress You know there are 12 months in a year. 1 month is what % of a year? 1/12 = .083. 2 months is what % of a year? 2/12 = .166 and we could continue on. Example of lr Liquid assets = 2,225 and total current debt = 22,589. lr = 2225/22589 = .098 When we think about .098 as % of the year, we see an lr of .098 means liquid assets would only cover a little more than 1 month off current liabilities. A rule of thumb is to have from 3 to 6 months tucked away in case you lose you job. SO the ratio should be at least .25 to .5.