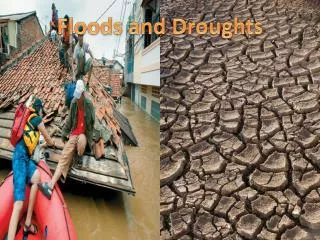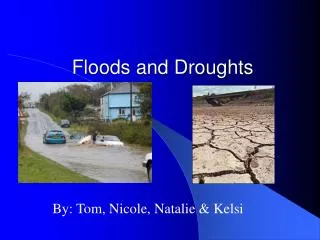
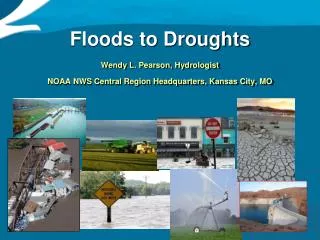
Floods to Droughts
Floods to Droughts. Wendy L. Pearson, Hydrologist NOAA NWS Central Region Headquarters, Kansas City, MO. Living Near the River. http://www.classzone.com/books/earth_science/terc/content/investigations/es1308/es1308page01.cfm. NOAA’s NWS Mission.

Floods to Droughts
E N D
Presentation Transcript
Floods to Droughts Wendy L. Pearson, Hydrologist NOAA NWS Central Region Headquarters, Kansas City, MO
Living Near the River http://www.classzone.com/books/earth_science/terc/content/investigations/es1308/es1308page01.cfm
NOAA’s NWS Mission • Provide weather, hydrologic, and climate forecasts and warnings for the United States for the protection of life and property and the enhancement of the national economy
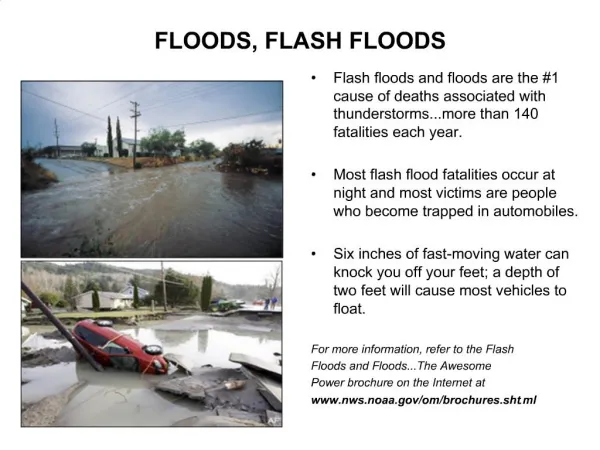
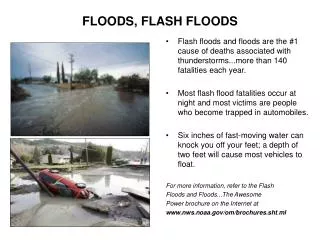
Flood Safety http://www.floodsafety.noaa.gov http://www.floodsafety.com/ * Vehicles can be swept downstream in as little as 6 inches of moving water.
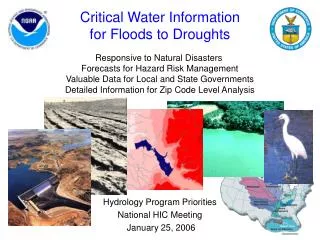
Reliable Water Information and Services for Decision Makers Water Management Drought Mitigation Flood Control Public Safety (Flash Floods, Debris Flow) Water Supply Waterway Commerce Power Generation Agriculture Recreation Ecosystem Health Weather and Climate Information: Temperature Precipitation Wind, … Water Information Hydrology and Water Resource Modeling “Summit to the Sea” Socioeconomic Sciences
What is a Flood? • Flash Flood • River Flood • Low Water Crossing • Hurricane Storm Surge • Hurricane Inland Flooding • Snowmelt Flooding • Overland Flooding • Dam Failures
Severity of Flooding • Minor Flooding • Moderate Flooding • Major Flooding • Record Flooding
Frequency of Flooding 100 year flood = 1% Flood 500 year flood = 0.2% Flood
River Developed Shrubs/Grass Agriculture Wetlands Forecast Basin Forecast Point Water Predictions for Life Decisions NOAA Water Forecasts: Where you are, when you need them • Snowpack • Precipitation • Soil moisture • River flow • Surface storage • Ground water Flood warnings for local communities Critical hydrologic information for neighborhoods and watersheds Water supply and soil condition forecasts for drought risk management Working Together: Federal, Tribal, State, and Local Agencies, Private Sector and Academia
NOAA Hydrologic Service Delivery 13 River Forecast Centers (Areas are in Color) 122 Weather Forecast Offices (Areas Outlined in Black) Hydrometeorological Prediction Center (HPC) Environmental Modeling Center (EMC) Climate Prediction Center (CPC) Camp Springs, MD
(numerous) Via Satellite, LFWS Coop Obs. (numerous) Gridded Products Tabular Forecast ~~~ ~~ ~~ ~~ ~~~ ~~ ~~ ~~ ~~~ ~~ ~~ ~~ ~~~ ~~ ~~ ~~ ~~~ ~~ ~~ ~~ ~~~ ~~ ~~ ~~ ~~~ ~~ ~~ ~~ Hydrograph Text Products ~~~~~~~~~~~~~~~ ~~~~~~~~~~~~~~~ ~~~~~~~~~~~~~~~ ~~~~~~~~~~~~~~~ ~~~~~~~~~~~~~~~ ~~~~~~~~~~~~~~~ ~~~~~~~~~~~~~~~ Partners NWS Products and ServicesRiver Forecast Centers NCEP QPF WFO NEXRAD 1 WFO NEXRAD 2 WFO NEXRAD 3 • Short and Extended Range Streamflow Forecasts • Flash Flood Guidance • Interagency Support Activities • Hydrometeorological Discussions • Hydrometeorological Support Products and Services NCEP Graphical and Gridded Products
Gridded Products NWS Products and ServicesWeather Forecast Offices NEXRAD (many) RFC Graphical, Gridded,and Tabular Products (many) Warnings~~~~~~~~~~~~~~~~~~~~~~~~~~~~~~~~~~~~ ~~~~~~~~~~~~~~~~~~~~~~~~~~~~~~~~~~~~ ~~~~~~~~~~~~~~~~~~~~~~~~~~~~~~~~~~~~ Public Forecasts~~~~~~~~~~~~~~~~~~~~~~~~~~~~~~~~~~~~ ~~~~~~~~~~~~~~~~~~~~~~~~~~~~~~~~~~~~ ~~~~~~~~~~~~~~~~~~~~~~~~~~~~~~~~~~~~ • Public Forecast and Warnings • Flash Flood Forecast and Warnings • Service Hydrologist Customer Coordination • Warning Coordination Meteorologist Service Coordination / Outreach NCEP Weather and Climate Graphical and Gridded Products
Advanced Hydrologic Prediction Service (AHPS) http://www.weather.gov/ahps/ • Provide improved water availability and flood warning information by leveraging NOAA’s infrastructure and expertise • Modernize services through infusion of new science and technology • Enhanced decision support • Quantification of forecast certainty • More accurate and timely forecasts and warnings • Flood mapping • Visually products
Probability Information Two Ensembles: • Conditional Simulations (CS) • 55 simulations each starting with the current model states only • Blend of forecast and historic data drive the model • Historical Simulation (HS) • one simulation for entire period of record • 55 Hydrographs starting over a range of initial conditions • Represents the hydrologic model climatology
Decision Support InformationConveying Certainty Difference indicates relative departure from “normal” Low Flow Information
Fargo, ND 2009 Iowa City 2009 Cedar Rapids 2009 Cedar Rapids 2008
Distributed Hydrologic Modeling • Generate high resolution soil moisture estimates • Agricultural use • Debris flows • Drought • Extend to finer scales • Accommodate land use change impacts
Flood Inundation Mapping Located with NWS river forecast locations Depicts flooding from minor to historical levels Communities can see potential impacts to the flood-prone areas NOAA is working with partners; states, FEMA, USGS, and USACE to communicate Flood Risks.
NOAA National Weather Service • AHPS Flood Mapping depends on partnerships, diligence, dedication, and commitment.
New Business Model for Water Forecasting: Community Hydrologic Prediction System (CHPS) • The new approach provides: • Open system architecture to easily accommodate addition of models, data, and procedures • Modern platform for collaboration with national/international agencies, universities, and private sector to leverage work of others • Historically, organizations and groups: • Worked independently • Developed their own unlinked systems • Duplicated efforts • Used disparate tools and processes HistoricalApproach New Approach
Emerging Strategy to Advance Water Forecasting • Enable Full Use of Existing and New Observing Systems • Accelerate Research-to-Operations • Incorporate models and science developed by partners • Deploy integrated (water, climate, ecosystem information) services for time scales of hours to months Private Sector Integrated Water Resources Science and Services (IWRSS) Bureau of Reclamation EPA User Needs and Requirements NOAA’s R&D and Testbeds High Resolution Observations and Models Community Hydrologic Prediction System NASA USGS Regional Demonstration Projects NOAA’s Unified Mission Delivery and Support Services USACE USDA Academia
Initial Federal Partnership for Integrated Water Resources Science and Services Hydraulic Engineering Center Hydrology Program Water Resources Institute Coastal Services Center USACE NOAA Remote Sensing Centers HydrometTestbed Forecast Offices Cold Regions Research Lab USGS Water Discipline Water Science Centers Geography Discipline • Aligning multi-agency collaboration is essential • Provide the Nation with a seamless suite of consistent water resources monitoring and forecast information – summit to sea • Sustain quality of life and the natural environment • “No water agency can meet the full array of climate change-induced water problems on its own”
Integrating to Address the Challenges ForAll Water Agencies To address growing demand for relevant and reliable water information, we must integrate our water science and services to provide our Nation with water information when and where it is needed. • “In this century, the U.S. will be challenged to provide sufficient quantities of high-quality water to its growing population.” • - National Research Council • Estimates of economic losses from recent western droughts are “billions of dollars”. • - Western Governors Association • Competition for increasingly limited freshwater resources will make “water supply availability a major economic driver in the 21st century”. • - Nature • The provision of adequate fresh-water resources for humans and ecosystems will be one of the most critical and potentially contentious issues facing society and governments at all levels in the 21st century. • - American Meteorological Society Integrating Water Science and Services
Homework • Safety is always #1 • Water runs down hill but which way is that? • What kind of flood is it? • What were the contributing factors? • What factors will increase uncertainty of forecast? • Can I help explain forecasts? • Societal and Economic Impacts? • What are the roles and responsibilities of local, state, and federal organizations involved? • Media of all types are partners with NOAA NWS. We need storytellers to tell the flood forecast story!
When FLOODS make Headlines • Deaths • Record Flooding • Evacuations • Possible Disasters • Millions of Sandbags and thousands of volunteers • Road closures and washouts
NWS Message • Text and Graphics online • Talking Points and Sound Bites • Headlines • Complex Situations • Scientific Jargon • Uncertainty
New Media • Internet • U tube • Online Radio • TV station web pages • News Papers Online • Blogs • Twitter
Flood News in Pictures • http://www.boston.com/bigpicture/2009/03/red_river_flooding.html • http://www.iowaflood.com/ • http://nd.water.usgs.gov/photos/1997RedFlood/