Download
1 / 24
240 likes | 367 Vues
LESSON 4: FORECASTING. Outline Forecasting Success Stories Decisions Based on Forecasts Characteristics of Forecasts Components of demand Evaluation of forecasts. Forecasting Success Stories.

E N D
LESSON 4: FORECASTING Outline • Forecasting Success Stories • Decisions Based on Forecasts • Characteristics of Forecasts • Components of demand • Evaluation of forecasts
Forecasting Success Stories • Sharing forecasting information along the supply chain is not very common. The result is forecast error as much as 60 percent of actual demand. US economy alone can save $179 billion in inventory investment with a coordinated forecasting. Wal-Mart has initiated such a process with Warner-Lambert, a manufacturer of Listerine. • Hewlett-Packard uses forecasting method for new product development.
Forecasting Success Stories • Taco Bell developed a forecasting method that gives customer demand for every 15-minute interval. The forecast is used to determine the number of employees required. Taco Bell achieved labor savings of more than $40 million from 1993 to 1996. • Compaq delayed the announcement of several new Pentium-based models in 1994. The decision was based on a forecasting method and contrary to the company belief.
Forecasting Success Stories • Forecasting is necessary to determine the number of reservations an airline should accept for a particular flight - overbooking, traffic management, discount allocation, etc.
Production Aggregate planning, inventory control, scheduling Marketing New product introduction, sales-force allocation, promotions Finance Plant/equipment investment, budgetary planning Personnel Workforce planning, hiring, layoff Decisions Based on Forecasts
The decisions should not be segregated by functional area, as they influence each other and are best best made jointly. For example, Coca-cola considers the demand forecast over the coming quarter and decides on the timing of various promotions. The promotion information is then used to update the demand forecast. Based on this forecast, Coca-Cola will decide on a production plan for the quarter. This plan may require additional investment, hiring, or perhaps subcontracting of production. Coke will make these decisions based on the production plan and existing capacity, and it must make them all in advance of actual production. Decisions Based on Forecasts
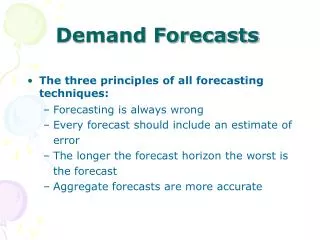
Forecasts are always wrong; so consider both expected value and a measure of forecast error. Long-term forecasts are less accurate than short-term forecasts. For example, 7-Eleven Japan Characteristics of Forecasts has a replenishment process that enables it to respond to an order within hours. If a store manager places an order by 10 am, the order is delivered by 7 pm the same day. The store manager thus has to forecast what will sell that night less than 12 hours before the actual sale.
Some time series (called aggregate series) are obtained by summing up more than one time series (called disaggregate series) . For example, annual sales are obtained by adding 12 monthly sales. The annual sales is an aggregate series and monthly sales is a disaggregate series. Aggregate forecasts are more accurate than disaggregate forecasts. Variation in GDP of a country is much less than the annual earnings of a company. Consequently, it is easy to forecast the GDP of a country with less than 2% error. However, it is much more difficult to forecast annual earning of a company with less than a 2% error. Characteristics of Forecasts
Components of Demand • Average demand • Trend • Gradual shift in average demand • Seasonal pattern • Periodic oscillation in demand which repeats • Cycle • Similar to seasonal patterns, length and magnitude of the cycle may vary • Random movements • Auto-correlation
Components of Demand Qantity Time (a) Average: Data cluster about a horizontal line.
Components of Demand Quantity Time (b) Linear trend: Data consistently increase or decrease.
Components of Demand Year 1 Quantity | | | | | | | | | | | | J F M A M J J A S O N D Months (c) Seasonal influence: Data consistently show peaks and valleys.
Components of Demand Year 1 Quantity Year 2 | | | | | | | | | | | | J F M A M J J A S O N D Months (c) Seasonal influence: Data consistently show peaks and valleys.
Components of Demand Quantity | | | | | | 1 2 3 4 5 6 Years (c) Cyclical movements: Gradual changes over extended periods of time.
Components of Demand Suppose that a company has institute a sales incentive system that provides a bonus for the employee with the best improvement in bookings from one month to the next. With such an incentive in place, a month of poor sales is often followed by a month of good sales. Similarly, a month of good sales would usually be followed by a lull.
Components of Demand This means that sales in consecutive months tend to be negatively correlated. This information can be used to improve sales forecasts. Autocorrelation is the correlation among values of observed data separated by a fixed number of periods. In the example above, we would say that the series has a negative autocorrelation of order one.
Components of Demand Trend Demand Random movement Time Demand Trend with seasonal pattern Time
Snow Skiing Seasonal Long term growth trend Demand for skiing products increased sharply after the Nagano Olympics
Evaluation of Forecast There are many forecasting techniques and software. The performance of a forecasting technique can be measured by the error produced over time. We shall now discuss various measures used to evaluate forecasting techniques. Let,
Measures of Forecast Error Et = Ft - Dt MAD = MSE = MAPE = = MSE |Et | n Et2 n [|Et | (100)]/Dt n Evaluation of Forecast
Absolute Error Absolute Percent Month, Demand, Forecast, Error, Squared, Error, Error, tDtFtEt Et2 |Et| (|Et|/Dt)(100) 1 200 225 2 240 220 3 300 285 4 270 290 5 230 250 6 260 240 7 210 250 8 275 240 - Total Evaluation of Forecast
Measures of Error MSE = = MAD = = MAPE = = Evaluation of Forecast
READING AND EXERCISES Lesson 4 Reading: Section 2.1-2.6, pp. 55-66 (4th Ed.), pp. 51-63 (5th Ed.) Exercises: 12, 13, 15, pp. 65-66 (4th Ed.), pp. 62-63 (5th Ed.)