1 / 6

The following spectra are for the sugar derivative shown below.

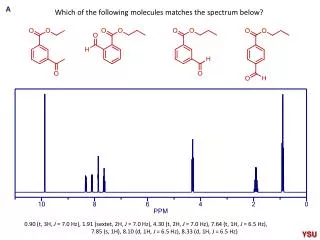
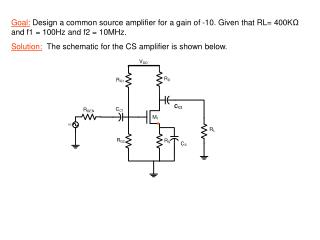
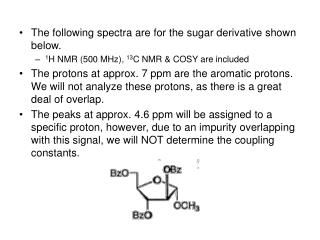
The following spectra are for the sugar derivative shown below. 1 H NMR (500 MHz), 13 C NMR & COSY are included The protons at approx. 7 ppm are the aromatic protons. We will not analyze these protons, as there is a great deal of overlap.

vin
Télécharger la présentation

The following spectra are for the sugar derivative shown below.

An Image/Link below is provided (as is) to download presentation Download Policy: Content on the Website is provided to you AS IS for your information and personal use and may not be sold / licensed / shared on other websites without getting consent from its author. Content is provided to you AS IS for your information and personal use only. Download presentation by click this link. While downloading, if for some reason you are not able to download a presentation, the publisher may have deleted the file from their server. During download, if you can't get a presentation, the file might be deleted by the publisher.

E N D

Presentation Transcript


  1. The following spectra are for the sugar derivative shown below. • 1H NMR (500 MHz), 13C NMR & COSY are included • The protons at approx. 7 ppm are the aromatic protons. We will not analyze these protons, as there is a great deal of overlap. • The peaks at approx. 4.6 ppm will be assigned to a specific proton, however, due to an impurity overlapping with this signal, we will NOT determine the coupling constants.

  2. 1H NMR

  3. 1H NMR

  4. COSY

  5. 13C NMR

  6. HSQC

More Related