Download
1 / 63
660 likes | 1.02k Vues
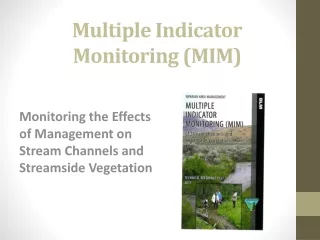
Multiple Indicator Monitoring (MIM). Monitoring the Effects of Management on Stream Channels and Streamside Vegetation. Timothy A. Burton, Consultant, RMSMIM, retired BLM Fisheries Biologist Steven J. Smith, Range/Riparian Specialist, Team Leader, National Riparian Service Team

E N D
Multiple Indicator Monitoring(MIM) Monitoring the Effects of Management on Stream Channels and Streamside Vegetation Timothy A. Burton, Consultant, RMSMIM, retired BLM Fisheries Biologist Steven J. Smith, Range/Riparian Specialist, Team Leader, National Riparian Service Team Ervin R. Cowley, Consultant, RMSMIM, retired BLM Range/Riparian Specialist
Outline 1. Introduction - Overview of MIM 2. Background – History of MIM Development 3. MIM Content & Procedures – Overview of the Protocol 4. Technical Reference Development Process
Original Idea Since most of the cost of monitoring is getting there… • Be efficient: Do more than one indicator at the same time… • Be effective: Short- and Long-term indicators at the same time and location… • Relationships • Cause-and-effect • Inform adaptive management
Among all of the existing indicators, which should we use? • Direct measures (temperature and humidity) • Canopy closure - over stream and riparian • Seral stage/structural complexity of riparian vegetation • Fish/wildlife distribution, abundance, connectivity • Native riparian community mosaic composition regime • Soil quality - moisture, compaction, organics • Presence/absence of a defined stream channel, width-to-depth ratio, frequency of large pools, longitudinal profiles, residual pool , depth, bank angles, shore depth, substrate, and so forth • Flood-plain interactions/connectivity • Number of dams and diversions, acres of reservoirs • Animal Unit Months (cattle and pack stock)a • Ground-water condition • Habitat mapping (fast/slow water) • Width-to-depth ratio, frequency of large pools, longitudinal profiles, residual pool depth, bank angles, shore depth, substrate, and so forth • Flood-plain interactions/connectivity • Number of dams and diversions, acres of reservoirs • Animal Unit Months (cattle and pack stock) a • Mining history/extent • Root density/bank stability• Hydrographs - peak flow, frequency, and so forth • Watershed/near-stream road density • Elongation of stream into ditches (length) • Number of culverts and stream crossings • Culvert failure rate • Number of dams and diversions, acres of reservoirs • Length of perennial stream (ratio to intermittent)a • Lake/pond water level • Mining history/extent • Ground-water condition • Soil quality - compaction, cover, organics • Fragmentation of riparian vegetation - high contrast • Fragmentation of riparian vegetation - low contrast • Seral stage/structural complexity of riparian • Native riparian community mosaic, • In-stream/lake aquatic vegetation • EXAMPLES: • Riparian vegetation Composition • Bank stability • Stubble Height • Channel width • Fish/wildlife populations parameters • Fish/wildlife distribution, abundance, connectivity • Timber harvest history • Location/size of recreation sites • Location/size of other disturbance • Chemical and nutrient content of water • Invertebrate community structure • Instream-channel carbon load • Fire frequency • Primary productivity/algal community • Native riparian community mosaic, composition • Number of reported toxic spills - type and quantity • Water quality - direct measures • Sublethal/mortality effects on vertebrates • Invertebrate community structure • Seral stage/structural complexity of riparian • Number of culverts and stream crossings • Fish/wildlife population • Fish/wildlife distribution, abundance, connectivity • Genetic diversity/similarity • Fish health • Angler/hunter surveys • Community composition/integrity metrics • Special habitats distribution and abundance • Fish stocking history • Instream - channel sediment measures • Channel morphology • Slope erosion indicators • Frequency, distribution, arrangement of LWD • Large tree density/diameter • Seral stage/structural complexity of riparian • Slope erosion indicators • Number of dams and diversions, acres of reservoirs • Water Temperature Direct measures • Canopy closure - over stream and riparian • Presence/distribution of special thermal habitats • Fish/wildlife distribution, abundance, connectivity • Length of perennial stream, ratio to intermittent
To be efficient… • Indicators must address/answer key questions concerning some issue • e.g. Issue – Livestock grazing effects on stream & riparian habitats. • Key question: What affect does this use have on the riparian vegetation and stream? • What levels of use are actually occurring in-season & post-season? Indicators: Stubble height, bank alteration, woody browse • What are the trends in riparian and stream condition? Indicators: Greenline veg composition, GGW, Bank stability/cover, substrate size distribution
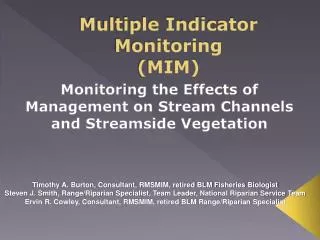
Many sites are remote – much of the time is spent getting there
Can we be effective and minimize the use of costly, time-consuming methods? For riparian grazing, Stubble Height was seen as one such tool, but…
University of Idaho Stubble Height Review Team Reviewed the use of “stubble height”, a short-term indicator of grazing effects, but they concluded… “Emphasis should be placed on long-term monitoring of trend to determine whether resource management objectives are being met” Stubble Height is a grazing use indicator, not a resource objective. Stubble height research site – Stanley Creek, ID
Solution… • Other monitoring tools that can be implemented in conjunction with Stubble Height, not requiring a great deal more time
What should we monitor? • “Long-term monitoring of vegetation composition on the greenline, streambank stability and regeneration of woody species are the true measures of whether riparian management objectives are being met.” (U of I Stubble Height Review Team) • “Annual indicators, such as stubble height, are only useful for interpretation of why trend is not satisfactory.” (U of I Stubble Height Review Team)
THUS: Both Short and Long Term Indicators Together • To improve efficiency, reduce costs and time to sample • To allow statistical comparisons between short-and long-term indicators • To identify which indicator(s) best reflect grazing (and other) influences
To be effective… • Must be able to detect change • Requires • Precision – repeatability (agreement between repeated observations). • Addressed by using & testing rule set with trained observers • Accuracy – reasonable level of confidence in predicting the true value • Addressed by collecting appropriate sample size
Therefore, there was a need to have a protocol that: • Addresses multiple indicators • Is efficient, fast, with electronic data collection & summary • Is effective (measures most important indicators that are the most useful in detecting change) • Yields statistically acceptable results given realistic time constraints • Uses existing protocols to extent possible • Provides useful data to inform management MIM was designed to address each of these issues!
MIM Technical Reference : • Instructions for locating the appropriate Designated Monitoring Area (DMA) • Instructions for locating the greenline plot locations (from which all data are collected) • Procedures for 3 short term indicators: • Stubble Height, Streambank Alteration, Woody Browse • Procedures for 5 long-term indicators: • Greenline Vegetation, Streambank Stability, Woody Species Age-class & Height, Greenline to Greenline Width, Substrate • A protocol built largely from existing procedures & adapted to plots • An automated format (excel) for electronic data collection and summary
QUADRAT PLOTS • Stubble ht, 2. bank alteration, 3. woody browse, 4. greenline veg, 5. bank stability, 6. woody regeneration – on the greenline CROSS SECTION 7. Greenline-Greenline Width & 8. Substrate – in the cross- section- 9. Thalweg profile (new)
Automated MIM Metrics • Median & Mean Stubble Height • % Streambank Alteration • % Woody Browse Use • Mean Stubble Height for Dominant Key Species • % Stable Streambanks • % Covered Streambanks • % Saplings and Young Woody Vegetation • % Mature Woody Vegetation (and dead) • Vegetation Erosion Resistance (Greenline Stability Rating) • % Hydric Vegetation • % Hydric Herbaceous • Mean Greenline-Greenline Width (GGW) • Ecological Status • Wetland Rating • Substrate Composition (D16, D50, D84) • Pool frequency, pool residual depth
MIM is most useful for: • Small streams (<10 meters wide – wadable) • Snowmelt dominated & spring-fed streams • Monitoring the effects of grazing – however, the long-term indicators described in MIM are useful for monitoring changes that result from other management activities
2. Background History of MIM development
Early Work – Riparian Monitoring Has Evolved through time • 1983: Intermountain Research Station: Methods published by Platts, Megahan, and Minshall • Qualitative ratings • Cross-section approach • Low precision and a large amount of effort • 100 plus transects at 10 foot or less intervals • Too time consuming and low in precision
History • 1989: TR-1737-3: Inventory and Monitoring of riparian areas • Monitoring guidelines • Few details on protocol or methodology • Untested for precision and accuracy
History • 1992: Integrated Riparian Evaluation Guide, Forest Service Intermountain Region • First formal written guidance that included Dr. Alma Winward’s pioneering riparian work • Inventory • Monitoring • Stratified into 3 levels of intensity • Methods relied on existing protocols • Untested for precision and accuracy • Not conducive to collecting multiple indicators • Time-consuming and inefficient
History • 1993: Monitoring Protocols to Evaluate Water Quality Effects of Grazing Management on Western Rangeland Streams (EPA publication) • Detailed methods for water quality parameters and some in channel indicators • Method for collecting greenline vegetation and measuring bank stability • Untested for precision and accuracy • Not conducive to collecting multiple indicators • Time-consuming and inefficient
History • 1996 rev.1999: TR 1734-3: Interagency Technical Reference: Utilization Studies & Residual Measurements • Methods applied to grazing use only • Precision and accuracy were not evaluated • MIM incorporates the stubble height and woody browse utilization procedures (modified for plot technique & precision) which have now been tested for precision and accuracy
History • Late 1990’s: Beaverhead National Forest, methods for physical streambank alterations from livestock trampling • Not tested for precision and accuracy • Tested in the early 2000’s, along with the MIM approach to streambank alteration (Heitke et.al. 2008). • MIM streambank alteration procedure had the greatest precision, or level of agreement among observers (coefficient of variation = 20). • Compares with additional 32 separate tests of precision in which average coefficient of variation equaled 19.9. • Average difference among observers was 6%.
History • 2000: Forest Service Rocky Mtn. Research Station – Monitoring the Vegetation Resources in Riparian Areas (Alma Winward RMRS-GTR-47). • Has been used extensively. • Built from 1992 R4 Integrated Riparian Eval. Guide • Tests of precision and accuracy found this method marginally effective for monitoring trends. • Used a continuous pace transect, independence of samples was a problem for statistical evaluations. • Monitored plant communities rather than individual species – problematic for areas lacking community type classifications.
History • 2000 – 2002: PIBO, PACFISH/INFISH Effectiveness Monitoring Program. • The basis for many protocols in MIM. • Tested Greenline sampling methods of Winward (2000) and developed a new plot approach. • More consistent with monitoring guidelines coming from research – for vegetation BLM TR 1730-1 (Measuring and Monitoring Plant Populations, 1998), channel variables from testing by Kaufman and others (EPA/620/R-99, 1999), and the substrate monitoring guidelines from the Rocky Mtn Research Station – RMRS GRT-74 (Bunte and Apt 2001). • Perceived as too time consuming for general monitoring purposes
History • 2004: University of Idaho Stubble Height Study Report • Int. Region Forest Service & Idaho BLM entered into agreement with U of I CNR to study the Agencies’ use of stubble height • Led to establishment of interagency implementation team (R4 FS & Idaho BLM & others) • Team realized the agencies did not have an efficient, effective, reliable protocol for assessing short-term impacts & how they effect long-term riparian conditions at a given location
Since the agencies did not have a protocol to address these issues, MIM was developed • First version drafted and initially tested in 2004 (Burton, Cowley) • Printed as an “Idaho Technical Bulletin” in 2005 • First training/testing sessions offered in 2005 with Idaho BLM & R4 Forest Service (Burton, Cowley, Smith, Johnson, Forsman) • Over 30 training/testing sessions from 2004-2008 (approximately 1000 people) • Updated & revised annually as additional testing reveals required changes & improvements (2008 was version 5)
QUADRAT PLOTS • Stubble height, • Bank alteration, • Woody browse, • Greenline vegetation composition, • Woody species height • Bank stability, • Woody regeneration STREAM CHANNEL CROSS SECTION 8. Greenline-Greenline Width 9. Substrate size distribution 10. Thalweg profile
Why these indicators? • Measurable • Repeatable • Applicable to key elements of stream functionality • Reflect effects of riparian & channel disturbance • Tested for precision and accuracy • Best reflect the influences of land management
Plots placed on the “Greenline” The first perennial vegetation that forms a lineal grouping of community types on or near the water’s edge. (Winward 2000) Lineal Groups
Significance of the Greenline The “Greenline” Decreasing moisture Riparian plants Upland plants Water Table Stream Note depth to water table moving away from the stream: The “Moisture gradient”
Why on the Greenline?(as opposed to the Bankfull Level) • Vegetation at the greenline resists lateral forces of erosion. • Plant types at the greenline play a critical role in buffering the forces of water. • Plant types at the greenline reflect influence of water and can recover quickly after disturbance, making it the first location in the riparian zone to show change. • Over time, streams develop a balance between buffering by vegetation & erosion by water. This balance can be disrupted by anthropogenic disturbance & is evidenced by stability changes.
Why on the Greenline?(as opposed to the Bankfull Level) • It may be, and is often located near the bankfull stage, but encroachment into the active channel, or channel incision resulting in the greenline above bankfull stage are of interest in monitoring. • Testing (GGW) indicates good observer agreement (precision) in locating the greenline. In some streams, the lack of bankfull indicators makes precision in it’s location problematic.
50 cm 20 cm 12.5 cm 20 cm 1 2 3 4 5 Why Plots? • More data summary techniques are available • Smaller change can be detected • Many analysis opportunities – samples are independent • Plot size is two Daubenmire frames
Located by pacing within the channel ▲ ▲ Flow Frame placement on Greenline • At least 110 meters (361 feet) both sides of the stream • > 40 plots on each side, depending on site variability (estimated in data entry module) • Substrate is collected at every other plot across the channel
Sample Spacing (Elzinga et al.) Why not continuous? “Independence means that the sampling units are not correlated. For example, if quadrats are not correlated, high mortality in Quadrat A does not necessarily mean there will be high mortality in Quadrat B, at least not because of its proximity to Quadrat A.However, whenever quadrats are located fairly close together they will often respond similarly.”
How far apart is far enough? • Spacing: 40 plots per 110 meters of greenline = 220/40 = 2.75 meters apart • “Clearly, quadrats that are positioned contiguous to one another along a transect are not far enough apart to be considered independent.” (Elzinga et. al.) • “The average size of the plants” – should dictate minimum spacing. At 2.75 meters, some autocorrelation will occur with tree canopy.
Systematic Sampling “Useful for any type of sampling as long at the first sampling unit is selected randomly and the sampling units are far enough apart to be considered independent.” (Elzinga et al.)
Why Systematic Sampling? “One of the principal advantages of systematic sampling is the fact that it enables the investigator to sample evenly across a whole area. This results in good interspersion of sampling units throughout the area containing the target population. Systematic sampling is more efficient than simple random sampling.” (Elzinga et al.)
Random - Systematic Start Head stake & photo directions Direction of flow
Comparison of Sample Schemes MIM – 80+ plots 20 20 Winward continuous PIBO – 70 plots 15 15 10 10 5 5 1 1
Field PDA – Data Entry and Analysis Modules - Fast data handling