Pain delayed but not avoided
280 likes | 418 Vues
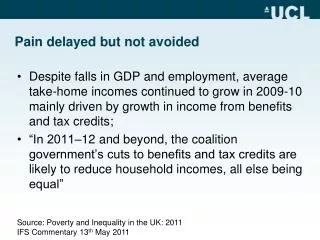
Pain delayed but not avoided. Despite falls in GDP and employment, average take-home incomes continued to grow in 2009-10 mainly driven by growth in income from benefits and tax credits;

Pain delayed but not avoided
E N D
Presentation Transcript
Pain delayed but not avoided • Despite falls in GDP and employment, average take-home incomes continued to grow in 2009-10 mainly driven by growth in income from benefits and tax credits; • “In 2011–12 and beyond, the coalition government’s cuts to benefits and tax credits are likely to reduce household incomes, all else being equal” Source: Poverty and Inequality in the UK: 2011 IFS Commentary 13th May 2011
Odds ratios (OR) for risk of mental illness in people with increasing numbers of debts:GB unadjusted (♦), adjusted for income (■) adjusted for income and key sociodemographic variables (age, ethnicity, marital status, household size, household tenure, education, social class,employment status, urban or rural, and region ( ). Source: Jenkins et al 2008
Fair Society: Healthy Lives: 6 Policy Objectives • Give every child the best start in life • Enable all children, young people and adults to maximise their capabilities and have control over their lives • Create fair employment and good work for all • Ensure healthy standard of living for all • Create and develop healthy and sustainable places and communities • Strengthen the role and impact of ill health prevention
Published by Friends of the Earth and Marmot Review Team Parliamentary Launch 12th May 2011
Direct health impacts - Mortality • Excess winter deaths are almost three times higher in the coldest quarter of housing than in the warmest quarter • 40% excess winter deaths attributable to cardio-vascular diseases • 33% excess winter deaths attributable to respiratory diseases
Direct health impacts - Morbidity • Children living in cold homes more than twice as likely to suffer from respiratory problems than children living in warm homes • More than 1 in 4 adolescents living in cold housing are at risk of multiple mental health problems, compared to 1 in 20 adolescents in warm housing • Cardio-vascular and respiratory diseases • Mental health • Colds and flu, exacerbates existing conditions such as arthritis and rheumatisms
Indirect health and social impacts • Cold housing negatively affects: • children’s educational attainment, emotional well-being and resilience • family dietary opportunities and choices • dexterity; and increases the risk of accidents and injuries in the home • Investing in the energy efficiency of housing can help stimulate the labour market and economy, as well as creating opportunities for skilling up the construction workforce
We can do better – international comparisons
Countries with more energy efficient housing have lower excess winter deaths (Healy 2003)
Greener living environments: lower health inequalities, England Deaths from circulatory disease Income group 4 is most deprived Source: Mitchell & Popham, Lancet 2008
Marmot Review: 6 Policy Objectives • Give every child the best start in life • Enable all children, young people and adults to maximise their capabilities and have control over their lives • Create fair employment and good work for all • Ensure healthy standard of living for all • Create and develop healthy and sustainable places and communities • Strengthen the role and impact of ill health prevention
Average weekly alcohol consumption by sex and socioeconomic class, GB: 2008 Mean number of units a week ONS General Lifestyle Survey 2008
Alcohol-attributable hospital admissions by small area deprivation quintile in England,2006-07
Action on the wider determinants - to tackle health inequalities • “Every sector a health sector” • Local authorities, Health and Social Services, Voluntary Sector have a key role to play at local level • Empower individuals and communities – create the conditions for people to take responsibility www.marmotreview.org
Marmot Review: recommended targets Across the social gradient: • Life expectancy • Healthy life expectancy • Readiness for school • Young people not in education, employment or training Target that progressively increases: • Proportion of households that have an income, after tax and benefits that is sufficient for healthy living
Public Health White Paper recognises: • that disadvantage accumulates over lifetime; • the need to address the wider determinants of health; • and approved the use of proportionate universalism as in Fair Society Healthy Lives • role of local authorities in leading on public health in partnership with the NHS
But: • Giving local communities control is challenging when they face budget cuts of 20-25%; • “responsibility deals” • Evidence from history suggests that public health advances – clean water, reduction of air pollution, healthier working conditions, reduction in drink-driving – have come to greater degree from action by local and central government than by voluntary agreements with industry. • While the White Paper picked up five of the six domains of recommendations from the Marmot Review it was silent on ensuring a healthy standard of living for all
Cost-Related Access Problems in the Past Year, by Income (Adjusted) percent experienced at least one of three problems** Note: Percentages adjusted based on logistic regression to control for health status, age, and—in the U.S.—insurance status. * Indicates significant within-country differences with below-average income (p < 0.05). ** Did not fill/skipped prescription, did not visit doctor with medical problem, and/or did not get recommended care. Source: 2010 Commonwealth Fund International Health Policy Survey in Eleven Countries.
Percentage shares of equivalised total gross and post-tax income, by quintile groups for all households, 1978 – 2007/8
Trends in income share among top income decile, US: 1913-2007 Source: Piketty and Saez (2003), series updated to 2007 by Saez in 2009
International comparisons of income mobility Higher score = lower intergenerational mobility Source: Blanden (2009) in NEP 2010.
Good Society? 1. Health inequalities Health and the distribution of health as social accountant 2. The causes of the causes Every Minister a Health Minister 3. Fundamental drivers
Age standardised mortality rates by socioeconomic (NS SEC) in the North East and South West regions, men aged 25-64, 2001-03
SMRs by cause, all ages: Glasgow relative to Liverpool & Manchester Source: Walsh D, Bendel N., Jones R, Hanlon P. It’s not ‘just deprivation’: why do equally deprived UK cities experience different health outcomes? Public Health, 2010 from H Burns, CMO, Scotland
Health improvement in difficult times • A major element of the excess risk of premature death seen in Scotland is psychosocially determined • Study evidence of low sense of control, self efficacy and self esteem in population in these areas Source: H. Burns, CMO Scotland
A Fair Society Conditions in which individuals &communities: Have control over their lives and Participate fully in society Website www.marmotreview.org