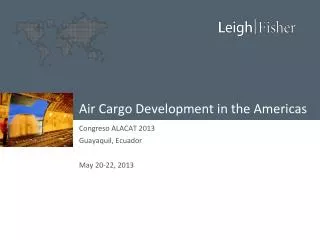
Air Cargo Development in the Americas
230 likes | 425 Vues
Air Cargo Development in the Americas. Congreso ALACAT 2013 Guayaquil, Ecuador May 20-22, 2013. Agenda Outline. Worldwide Air Cargo Indicators Air Cargo Trends in the Americas North America Latin America Conclusions Questions & Answers.

Air Cargo Development in the Americas
E N D
Presentation Transcript
Air Cargo Development in the Americas Congreso ALACAT 2013 Guayaquil, Ecuador May 20-22, 2013
Agenda Outline • Worldwide Air Cargo Indicators • Air Cargo Trends in the Americas • North America • Latin America • Conclusions • Questions & Answers LeighFisher has offices in Chicago, Cincinnati, Dallas, London, New Delhi, Ottawa, San Francisco, Toronto, and Washington, D.C. For over 65 years, we have assisted our clients in achieving their vision and goals. We have extensive practical experience in all disciplines necessary for the planning and management of airports, including airfield and airspace analyses, airport management and operation, commercial and concession planning, forecasting and economics, facilities planning and design, federal funding and policy development, financial analysis and planning, financial feasibility and reporting, ground transportation planning, air quality analysis, noise and other environmental analyses, privatization, parking planning and analysis, rental car facility development and business planning, security planning and implementation, and simulation and operational analyses. Joy Banerjee joy.banerjee@leighfisher.com +1.650.579.6404
Growth in supply of air cargo capacity outpaced demand growth, putting pressure on load factors and yields • Worldwide Freight Tonne Kilometres (FTK) and Available Tonne Kilometres (ATK) Growth ATK FTK Year over Year Growth (Percent) 2008 2009 2010 2011 2012 Source: IATA
…but the long term relationship between GDP growth and FTK growth has changed • World FTK Growth/GDP Growth Average 1980-2000: 2.44 Average* 2001-2011: 0.53 6 5 4 3 2 FTK Growth/GDP Growth 1 0 -1 -2 Factor FTK Growth / GDP Growth (until 2000) -60 Factor FTK Growth / GDP Growth (2001-2010) -61 1980 1981 1982 1983 1984 1985 1986 1987 1988 1989 1990 1991 1992 1993 1994 1995 1996 1997 1998 1999 2000 2001 2002 2003 2004 2005 2006 2007 2008 2009 2010 2011 Note:* excluding 2001, 2009 data Source: World Bank, ICAO, IMF, LeighFisher analysis
Two extraordinary air cargo decades ahead of us? Boeing World Air Cargo Forecast 2000/2001 “…the long-term air cargo market will grow at an average rate of 6.4 percent over the next 20 years -- a tripling of the market.” Billion FTK Boeing World Air Cargo Forecast 2010/2011 “…World air cargo traffic will expand at an average annual rate of 5.9% for the next two decades, triplingthe 2009 levels.” -30% Boeing World Air Cargo Forecast 2012/2013 “…Over the next 20 years, world air cargo traffic will grow 5.2%per year.World air cargo traffic will more than double over the next 20 years… ” 1999 2009 2019 2031 Boeing 2000-2019 Forecasted Growth (6.4%) 1999-2011 10-Year Average Growth (3.2%) Boeing 2012-2031 Forecasted Growth (5.2) Source: Boeing
Important Cargo Industry Issues – Past and Future • The “Unknown” • Japan tsunami • Volcanic ash cloud • Thailand flood • Hurricane Katrina • Swine flu • SARS • etc. • Economic and Financial Issues • Consumer spending • Euro • Oil price • Exchange rates • Supply Chain and Logistical Issues • Modal shift • Inventories • Sourcing trends (“Nearshoring”) • IATA e-Cargo • Regulatory Issues • Security • Carbon pricing • Trade agreements and embargoes • Industry Economics • Consolidation (NW, CO, IB, KL, MP, …) • Capacity: wide body passenger aircraft to replace freighter capacity? • Infrastructure Development • Panama Canal Expansion Project
In the Americas, there are vast differences in the relationship of drivers of air cargo versus air cargo tonnage • Market Saturation in the North and Growth Potential in the South? Population Share (2010) GDP Share (2011) Cargo Tonnage Share (2011) North America Rest Latin America North America 5.1% North America 8.7% 24.0% 30.3% Europe Asia 8.0% Latin America 64.3% 5.4% Latin America Middle East and Africa Asia Middle East and Africa European Union Rest of World Source: United Nations, Department of Economic and Social Affairs, Population Division (2011), World Population Prospects Source: International Monetary Fund, World Economic Outlook (2013) Source: Airports Council International , 2011 World Airport Traffic Report
North American air freight capacity growth has been contracting since March 2012, leading to above average load factors since September North American Freight Load Factors (in %), 2012 North American Freight Tonne Kilometres (FTK) and Available Tonne Kilometres (ATK) Year over Year Growth (in %), 2012 Ø 38 ATK FTK Jan Feb Mar Apr May Jun Jul Aug Sep Oct Nov Dec Jan Feb Mar Apr May Jun Jul Aug Sep Oct Nov Dec Source: IATA Source: IATA
Most of the top U.S. airports experienced a net decline in air cargo from 2001-2011 • Top US Airports Cargo Tonnage Change (%) 2001-2011 Memphis (MEM) Anchorage (ANC) Integrators and transit freight Louisville (SDF) Cincinnati (CVG) Miami (MIA) Los Angeles (LAX) New York (JFK) Chicago (ORD) Indianapolis (IND) Newark (EWR) Atlanta (ATL) Dallas/Fort Worth (DFW) Oakland (OAK) Houston (IAH) Philadelphia (PHL) San Francisco (SFO) Ontario (ONT) Honolulu (HNL) Washington DC (IAD) Seattle (SEA) Source: ACI Worldwide Airport Traffic Report 2002, ACI World Airport Traffic Report 2011.
Population growth will remain a fundamental driver of air cargo • Despite declining Population Growth Rates, LAC will have the third largest Population in the World by 2050, spread across three Regions 7% Population (millions) 0.47% NA…+29.7% 345 447 26% 700 ME…+58.4% 1.44% 369 585 600 EU -2.6% 738 719 67% 500 LAC +27.3% 590 751 NF +119.8% 941 2,068 400 Source: ComisionEconomico para America Latina y el Caribe (CEPAL), Central Latinamericano y Caribeno de Demografico (CELACDE), www.ecLAC.cl., United Nations, Department of Economic and Social Affairs, World Population Prospects. AS +20.4% 3,831 300 4,612 1990 2010 2020 2030 2050 Historic Projected Source: United Nations, Department of Economic and Social Affairs, Population Division (2011). World Population Prospects.
LAC GDP is dominated by few countries, while LAC foreign trade is shifting in favor of Asia LAC GDP Shares (2011) LAC Trade with World Regions (Billion USD, 2005 constant) +50% Other Ecuador Peru 2001 2011 1% Chile 4% +338% Colombia 6% Brazil +106% Venezuela 6% Argentina +208% +207% Mexico Africa Asia Europe Middle East North America Source: International Monetary Fund, World Economic Outlook Database, April 2012. Source: International Trade Centre, Accessed September 2012.
Latin American growth of air freight capacity supply and demand points into opposite directions, suppressing load factors Latin American Freight Load Factors (in %), 2012 Latin American Freight Tonne Kilometres (FTK) and Available Tonne Kilometres (ATK) Year over Year Growth (in %), 2012 ATK FTK Ø 38 Jan Feb Mar Apr May Jun Jul Aug Sep Oct Nov Dec Jan Feb Mar Apr May Jun Jul Aug Sep Oct Nov Dec Source: IATA Source: IATA
The 10 Top Latin American Airports account for more than 60% of Latin American Air Cargo Tonnage • Top Latin American Airports Cargo Tonnage (Thousand Metric Tons) and Share of Total (%) in 2011 2,000 40 Percentage Share 1,892 35 1,900 617 Tonnage (Metric Tons) 600 30 497 500 25 415 400 20 288 287 300 268 15 205 187 174 200 165 10 100 5 0 0 Bogota (BOG) Sao Paulo (GRU) Mexico City (MEX)* Santiago (SCL) Lima (LIM) Campinas (VCP) Buenos Aires (EZE) Quito (UIO) San Juan (SJU) Manaus (MAO) Rest Source: ACI Worldwide Airport Traffic Report 2002, 2003, ACI World Airport Traffic Report 2011.
The majority of top Latin American airports show double digit growth from 2001-2011 • Air Cargo Tonnage Change (%) at the Top 10 Latin American Airport, 2001-2011 Sao Paulo (GRU) Mexico City (MEX)* n/a Santiago (SCL) Lima (LIM) Campinas (VCP) Buenos Aires (EZE) Quito (UIO) San Juan (SJU) Manaus (MAO) *Mexico: 2002-2011 No data for Bogota, Guayaquil. Source: ACI Worldwide Airport Traffic Report 2002, 2003, ACI World Airport Traffic Report 2011.
Strong outlook for LAC air cargo growth, largest cluster on West Coast • Forecasted and current (2011) Cargo Tonnage (in Thousand Metric Tons) 4,995 -1,720 5,000 16,000 324 Chile 4,500 Colombia 14,000 34% 823 Ecuador 4,000 12,000 262 Peru +5.7% 3,500 312 10,000 3,000 2,500 1,518 8,000 2,000 6,000 1,500 713 4,000 -1,044 1,000 LeighFisher Forecast (Regression) 2,000 500 Boeing Forecast 0 0 Total LAC Andean States Brazil Mexico Rest of LAC* Source: LeighFisher estimate, November 2012, based on GDP forecasts by HSBC, World Bank World Development Indicators, International Financial Statistics of the IMF, IHS Global Insight, and Oxford Economic Forecasting, as well as estimated and projected values developed by the Economic Research Service, all converted to a 2005 base year. *Note: Data excludes Guatemala. Source: ACI World Traffic Report.
Major Latin American Air Cargo Flows in 2031 • Asia will dominate air cargo flows in 2031 Source: LeighFisher estimate, November 2012, based on GDP forecasts by HSBC, World Bank World Development Indicators, International Financial Statistics of the IMF, IHS Global Insight, and Oxford Economic Forecasting, as well as estimated and projected values developed by the Economic Research Service, all converted to a 2005 base year, and Boeing World Air Cargo Forecast 2012-13.
Planning ahead: Industry outlook and forecast • Worldwide • We need to be careful with forecasts, and with “rules of thumb”. Cargo will likely grow slower than in the past. • Most assumptions are between 3%-5%, but with substantial regional differences. • North America • Air cargo has undergone a transformation over the past decade • Growth rates remain low • Latin America Specific Challenges • Infrastructure • Geographic Location • Competition (Miami, other North American gateways)
Thanks for your attention — Q & A Joy Banerjee joy.banerjee@leighfisher.com +1.650.579.6404