Transpiration Lab
Transpiration Lab. Lab 11. http://www.cleanvideosearch.com/media/action/yt/watch?v=FEfmTok3OCo. Background. Cells and organisms must exchange matter with the environment to grow, reproduce, and maintain organization, and the availability of resources influences responses and activities.

Transpiration Lab
E N D
Presentation Transcript
Transpiration Lab Lab 11 http://www.cleanvideosearch.com/media/action/yt/watch?v=FEfmTok3OCo
Background Cells and organisms must exchange matter with the environment to grow, reproduce, and maintain organization, and the availability of resources influences responses and activities. For example, water and macronutrients are used to synthesize new molecules, and, in plants, water is essential for photosynthesis.
Organisms have evolved various mechanisms for accumulating sufficient quantities of water, ions, and other nutrients and for keeping them properly balanced to maintain homeostasis
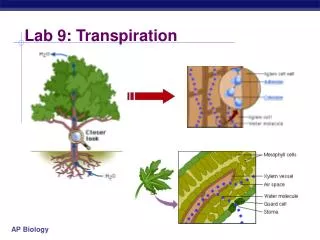
Movement of Water Through Cells • - Two Routes, the Symplast and the ApoplastSymplastic Movement • Movement of water and solutes through the continuous connection of cytoplasm (though plasmodesmata) • No crossing of the plasma membrane (once it is in the symplast - however, if the solute was initially external to the cell, then it must have crossed one plasma membrane to enter the symplast) • Apoplastic MovementMovement of water and solutes through the cell walls and the intercellular spaces • No crossing of the plasma membrane • More rapid - less resistance to the flow of water
Apoplast (through cell wall- usually water- like xylem) and symplast (through cytoplasm- usually sugars- like pholem)pathways
In general, animals possess one or more mechanisms, such as those involved in excretion, that let them ingest solutions of nutrients and transport and/or eliminate any excess ions or water.
However, plants take a different approach; they absorb and transport water, nutrients, and ions from the surrounding soil via osmosis, diffusion, and active transport.
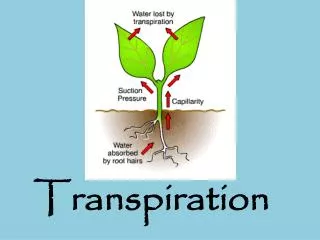
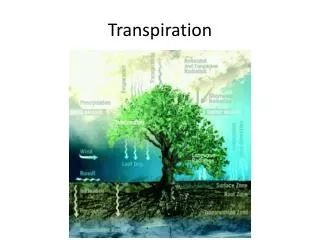
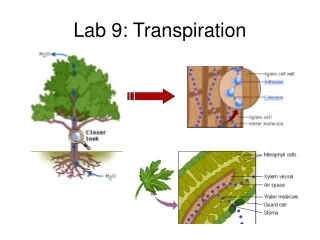
Once water and dissolved nutrients have entered the root xylem, they are transported upward to the stems and leaves as part of the process of transpiration (the evaporation of water from the plant surface)..
The amount of water needed daily by plants for the growth and maintenance of tissues is small in comparison to the amount that is lost through transpiration. Too much water loss can be detrimental to plants; they can wilt and die
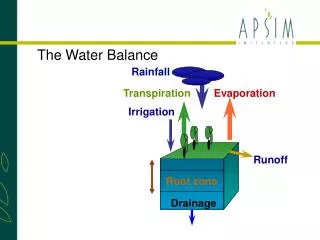
The transport of water upward from roots to shoots in the xylem is governed by differences in water (or osmotic) potential, and these differences account for water movement from cell to cell or over long distances in the plant. Several factors, including environmental pressure and solute concentration, contribute to water potential, with water always moving from an area of high water potential (higher free energy, more water) to lower potential (less free energy, less water).
The process is facilitated by osmosis, root pressure, and the physical and chemical properties of water. Transpiration creates a lower osmotic potential in the leaf, and the TACT (transpiration, adhesion, cohesion, and tension) mechanism describes the forces that move water and dissolved nutrients up the xylem, as modeled in Figure 1.
In an animal cell, water flows from hypotonic to hypertonic solutions, but in a plant cell, there is the added presence of the pressure created by the cell wallThe combination of solute concentration differences and physical pressure are incorporated into water potential, abbreviated with the Greek letter psi ψ
Water will flow through a membrane from a solution of high water potential to a solution of low water potential • Water potential is measured in units of megapascals (MPa) • Pure water has a water potential of 0 MPaψ = 0 MPa) • The addition of solutes lowers water potential ψ = -0.2 MPa for instance) • An increase in pressure (by lowering a piston for example) will raise water potential • These two forces combine to form the following equation: • ψ = ψ p + ψ s • ψ = total water potential • ψ p = water potential due to pressure • May be positive or negative • ψ s = water potential due solute concentration (also known as Osmotic Potential) • Always negative or zero
So… if a cell is found to have a solute pressure of -.45MPa and is not gaining or losing water, and is in an open container of water with a solute pressure of -.40MPa, what would be the osmotic pressure of the cell?
So… if a cell is found to have a solute pressure of -.45MPa and is not gaining or losing water, and is in an open container of water with a solute pressure of -.40MPa, what would be the osmotic pressure of the cell? • The water has a 0.00MPa ψ s osmotic pressure so the cell must have a +.05 ψ p to make the two equal so that there is not net gain or loss of water between them!
During transpiration, water evaporating from the spaces within leaves escapes through small pores called stomata. Although evaporation of water through open stomata is a major route of water loss in plants, the stomata must open to allow for the entry of CO2 used in photosynthesis. .
In addition, O2 produced in photosynthesis exits through open stomata. Consequently, a balance must be maintained between the transport of CO2 and O2 and the loss of water. • Specialized cells called guard cells help regulate the opening and closing of stomata.
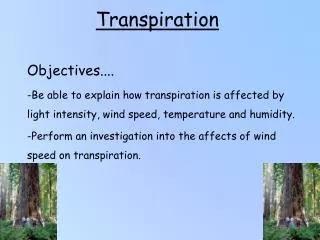
To maintain homeostasis, plants must adjust their rates of transpiration in response to environmental conditions
Safety and Housekeeping • be careful when assembling the equipment and when using a razor blade or scalpel to cut the stem of the plant cutting to a 45° angle. • wear safety goggles while conducting the experiments. • Nail polish is toxic by ingestion and inhalation; avoid eye contact with it. • Plant cuttings can be disposed of in the trash, and any paper waste should be recycled. • Plastic tubing and pipettes can be reused.
■■Enduring Understandings • 1A2: Natural selection acts on phenotypic variations in populations. • 2A3: Organisms must exchange matter with the environment to grow, reproduce, and maintain organization. • 2B1: Cell membranes are selectively permeable due to their structure. • 2B2: Growth and dynamic homeostasis are maintained by the constant movement of molecules across membranes. • 2D1: All biological systems from cells and organisms to populations, communities, and ecosystems are affected by complex biotic and abiotic interactions involving the exchange of matter and free energy. • 4A4: Organisms exhibit complex properties due to interactions between their constituent parts. • 4A6: Interactions among living systems and with their environment result in the movement of matter and energy.
■■Learning Objectives • The student is able to connect evolutionary changes in a population over time to a change in the environment (1A2 & SP 7.1). • The student is able to use calculated surface area-to-volume ratios to predict which cell(s) might eliminate wastes or procure nutrients faster by diffusion (2A3 & SP 2.2). • The student is able to justify the selection of data regarding the type of molecules that an animal, plant, or bacterium will take up as necessary building blocks and excrete as waste products (2A3 & SP 4.1). • The student is able to represent graphically or model quantitatively the exchange of molecules between an organism and its environment, and the subsequent use of these molecules to build new molecules that facilitate dynamic homeostasis, growth, and reproduction (2A3 & SP 1.1, SP 1.4). • The student is able to predict the effects of change in a component(s) of a biological system on the functionality of an organism(s) (4A4 & SP 6.4). • The student is able to apply mathematical routines to quantities that describe interactions among living systems and their environment that result in the movement of matter and energy (4A6 & SP 2.2). • The student is able to use visual representation to analyze situations or solve problems qualitatively to illustrate how interactions among living systems and with their environment result in the movement of matter and energy (4A6 & SP 1.4).
Can you do the following? explain • The relationship between cell structure and function • The physical and chemical properties of water • The movement of molecules and ions across cell membranes by the processes of osmosis, diffusion, and active transport • Photosynthesis, particularly the transport and roles of CO2, O2, and H2O • The exchange of matter between biological systems and the environment • This investigation reinforces the following skills: • Measuring distance, volume, and/or mass using the metric system • Estimating leaf surface area • Using a microscope to examine cell structure • Constructing data tables and graphs • Communicating results and conclusions
Pre lab questions • 1. If a plant cell has a lower water potential than its surrounding environment, make a prediction about the movement of water across the cell membrane. In other words, will the cell gain water or lose water? Explain your answer in the form of a diagram with annotation
2. In the winter, salt is sometimes spread over icy roads. In the spring, after the ice has melted, grass often dies near these roads. What causes this to happen? Explain your answer in the form of a diagram with annotations.
3. Prepare a thin section of stem from your plant, and then examine it under the • microscope to identify the vascular tissues (xylem and phloem) and the structural • differences in their cells. Describe how the observed differences in cellular structure • reflect differences in function of the two types of vascular tissue.
4. If you wanted to transplant a tree, would you choose to move the tree in the winter, • when it doesn’t possess any leaves but it’s cold outside, or during the summer, when • the tree has leaves and it’s warm and sunny? Explain your answer
Data Tables and Charts • The pascal (Pa) is a unit of pressure, and there are 1,000 pascals in 1 kilopascal (kPa). One kPa is approximately the pressure exerted by a 10-g mass resting on a 1-cm2 area. • 101.3 kPa = 1 atm of pressure.
Materials • • Living representative plant species • Impatiens (a moisture-loving plant), • • Calculator, microscope, microscope • slides, clear cellophane tape, clear nail • polish, and scissors • • Additional supplies that you might • need after you choose a method to • determine leaf surface area
calculate leaf surface area • The rate of transpiration is measured as the amount of water lost/ square meter/ minute. Because water evaporates through the many stomata on the leaf surface, the rate of transpiration is directly related to the surface area. To arrive at the rate of transpiration, therefore, you must calculate the leaf surface area of each plant: Because most stomata are found in the lower epidermis, you will determine that surface area.
Lab Notebook requirements • Title • Pre-Lab questions A-H answers (Anacharis is an aquatic plant) • Step 2 Draw diagrams of the top and bottom of the leaf at 400X • Chart of 3 fields of view stomatal counts and averages • Calculations for # of stomata per mm and per cm Diameter of 400x is .45mm • Designing and Conducting your Experiment • Experimental question • Make a hypothesis about this experiment, rate of transpiration in the various situations for each group • Brief procedure for set up…
You must set up all 3 methods! • Collect data on whole plant and gas pressure • Data chart for whole plant method • Data chart for gas meter 30 min/data every 3 min • Data for calculating leaf surface area and whole plant surface area after running gas meter • Do the calculations based on the gas meter data. • Get class data on other groups • Control will be the plant that…..? • Answer the Analyzing Results questions • Answer the Evaluating the Results 1-3
Step 2 Make a wet mount of a nail polish stomatal peel to view leaf epidermis using the following technique: a. Obtain a leaf. (The leaf may remain on the plant or be removed.) b. Paint a solid patch of clear nail polish on the leaf surface being studied. Make a patch of at least one square centimeter. c. Allow the nail polish to dry completely. d. Press a piece of clean, clear cellophane tape to the dried nail polish patch. Using clear (not opaque) tape is essential here. You might also try pulling the peel away from the leaf without using any tape and then preparing a wet mount of the peel with a drop of water and a cover slip. e. Gently peel the nail polish patch from the leaf by pulling a corner of the tape and peeling the nail polish off the leaf. This is the leaf impression that you will examine. (Make only one leaf impression on each side of the leaf, especially if the leaf is going to be left on a live plant.)
f. Tape the peeled impression to a clean microscope slide. Use scissors to trim away • any excess tape. Label the slide as appropriate for the specimen being examined • and label the side of leaf from which the peel was taken. • g. Examine the leaf impression under a light microscope to at least 400X (or highest • magnification). Draw and label what you observe. Can you observe any stomata? • Search for areas where there are numerous stomata. • h. Count all the stomata in one microscopic field. Record the number. • i. Repeat counts for at least three other distinct microscopic fields and record the • number of stomata. • j. Determine an average number of stomata per microscopic field. • k. From the average number per microscopic field, calculate the number of stomata • per 1 mm2. You can estimate the area of the field of view by placing a transparent • plastic ruler along its diameter, measuring the field’s diameter, and then • calculating area by using πr2. (Most low-power fields have a diameter between • 1.5–2.0 mm.) • l. Trade slides with two other lab teams so you examine three different slides under • the microscope using the same procedure described above
■■Option 1: Potometer with or Without Gas Pressure Sensor • Using a razor blade, carefully cut the plant stem so that its diameter will fit into the piece • of plastic tubing in the potometer assembly. Note that it is often helpful to cut the stem • while it is submerged under water to prevent air bubbles from being introduced into the • xylem. Your teacher will provide additional instructions, if necessary. Please be careful • when using the razor blade! • If using the gas pressure sensor to collect data, connect the gas pressure sensor to • the computer interface. Prepare the computer for data collection by opening the file “10 • Transpiration” from the Biology with Vernier folder of LoggerPro. If using a pipette to • measure water loss, you will have to determine your method of data collection
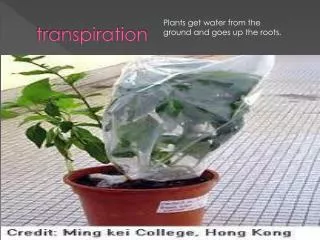
Option 2: Whole Plant Method • Step 1 Saturate the plant with water the day/night before beginning your investigation. • Step 2 Carefully remove a plant from the soil/pot, making sure to retain as much of • the root system and keeping soil particles attached to the roots. Wrap the root ball of • the plant(s) in a plastic bag and tie the bag around the base so that only the leaves are • exposed. (Be sure to remove all flowers and buds.) Do not water your plant any more • until you finish your experiment! You can also keep the plant in the plastic pot and place • it in the plastic bag.
Step 3 Determine the mass of each plant and then its mass for several days under your • environmental condition(s). • Step 4 Record your data in your lab notebook or as instructed by your teacher.
■■Calculations: Determining Surface Area and Transpiration • Rates • Step 1 In the first part of this lab, you were asked to investigate methods to calculate leaf • surface area and the surface area of all the leaves on a plant or plant cutting (depending • on your experimental setup). Your teacher may suggest a particular method. Determine • the total surface area of the leaves in cm2 and record the value. • Step 2 Calculate the rate of transpiration/surface area. If you are using a gas pressure • sensor to collect data, you can express these rate values as kPa/min/cm2, where kPa • (kilopascal) is a unit of pressure. Record the rate. • Step 3 After the entire class agrees on an appropriate control, subtract the control rate • from the experimental value. Record this adjusted rate. • Step 4 Record the adjusted rate for your experimental test on the board to share with • other lab groups. Record the class results for each of the environmental variables • investigated. • Step 5 Graph the class results to show the effects of different environmental variables on • the rate of transpiration. You may need to convert data to scientific notation with all • numbers reported to the same power of 10 for graphing purposes. • Step 6 Your teacher may suggest you perform statistical analysis (e.g., a T-test) of your • data, comparing results of experimental variable(s) to controls.
■■Analyzing Results • 1. How was the rate of transpiration affected by your choice of experimental variable as • compared to the control? • 2. Think of a way you can effectively communicate your results to other lab groups. • By comparing results and conclusions, explain how changes or variables in • environmental conditions affect transpiration rates. • 3. Based on data collected from different lab groups, which environmental variable(s) • resulted in the greatest rate of water loss through transpiration? Explain why this • factor might increase water loss when compared to other factors. • 4. Why did you need to calculate leaf surface area to determine the rate(s) of • transpiration?
5. What structural or physiological adaptations enable plants to control water loss? • How might each adaptation affect transpiration? • 6. Make a prediction about the number of stomata in a leaf and the rate of • transpiration. What type(s) of experiments could you conduct to determine the • relationship between the number of stomata and the rate of transpiration? • 7. Create a diagram with annotation to explain how the TACT (transpiration, adhesion, • cohesion, tension) mechanism enables water and nutrients to travel up a 100-ft. tree. • Predict how a significant increase in ambient (environmental) temperature might • affect the rate of transpiration in this tree. Explain your prediction in terms of TACT • and the role of guard cells in regulating the opening and closing of stomata.
Evaluating Results • ■■ • 1. Was your initial hypothesis about the effect of your environmental variable on the • rate of transpiration supported by the data you collected? Why or why not? • 2. What were some challenges you had in performing your experiment? Did you make • any incorrect assumptions about the effect of environmental variables on the rate(s) • of transpiration? • 3. Were you able to perform without difficulty the mathematical routines required to • analyze your data? Which calculations, if any, were challenging or required help • from your classmates or teacher?
■■Where Can You Go from Here? • 1. Investigate how guard cells control the opening and closing of stomata, including the • role of abscisic acid and K+. • 2. Design an experiment to investigate transpiration in two different types of plants • — one that is drought tolerant and one that requires a significant amount of water. • What predictions can you make about the rate of transpiration in each? • 3. If you had to revise the design of your experiment, what suggestions would you • make? Why would you make them? • 4. If your investigations generated other questions that you might want to research, ask • your teacher if you can conduct other experiments.