Download
1 / 104
1.04k likes | 1.22k Vues
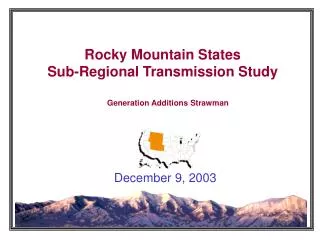
2008 Base Case Rocky Mountain Area Transmission Study (RMATS). February 5, 2004. Base Case Objectives. Focus on congestion that affects the cost of serving load in the RMATS sub-region Assess the current system Include existing system, plus new, viable investment already in progress

E N D
2008 Base CaseRocky Mountain Area Transmission Study (RMATS) February 5, 2004
Base Case Objectives • Focus on congestion that affects the cost of serving load in the RMATS sub-region • Assess the current system • Include existing system, plus new, viable investment already in progress • Identify incidence and duration of congestion • Estimate the resulting congestion costs • Include several load, gas price, and hydro sensitivities • Review plant performance • Illuminate opportunities for cost-effective projects • Estimate the incremental value of expansion on congested paths Base Case Runs * 2013 loads applied to 2008 resources and transmission 2008 Base Case
Modeling Approach • Modeled with ABB Market Simulator • Production cost model • West-wide scope with a particular focus on the RMATS region • Detailed transmission representation • Calculates nodal / bus prices • Hourly resolution • LP dispatch optimization is based on: • Variable O&M • Fuel cost • Transmission constraints • Impact of hydro and wind generation • Treated as a fixed dispatch to the system • After hydro and wind dispatch, the net load is passed to thermal dispatch • LMP differences are dampened as hydro is included • Single test year – 2008 • Existing system with incremental resources and transmission • All results presented in 2004 dollars • Load, gas price, and wind resource capacity sensitivities LMP- (Locational Marginal Price) The cost of delivering the next 1 MW of power to a particular location, or the savings from reducing load by 1 MW at that location (sometimes called shadow price). Locations are modeled at nodel/bus level 2008 Base Case
Modeling Limitations • Modeling assumes a single, seamless west-wide market with no rate or loss pancaking • No institutional, tariff, or contractual impediments to trade • Omits wheeling charges (wheeling is assumed to be common to all) • Does not calculate loss charges (losses are netted against load) • LP optimizes dispatch on a west-wide basis (perfect knowledge) • 1-world dispatch • Hydro and wind dispatch is determined outside ABB Market Simulator, then entered as shaped inputs around which thermal resources are dispatched • Perfect foresight on loads, transmission usage & reserve requirements • Not modeled: • Must-run generation • Unit commitment • Transmission wheeling and loss charges • Generator forced outages • Contractual / tariff constraints • Bid behavior • Policy related items such as renewable portfolio standards (RPS) & carbon emission limitations • Sub-hourly operations • Actual heat rate curves- approximate only 2008 Base Case
Implications of Limitations • Tends to make fuller, more optimal use of transmission than operations currently allow • Analogous to seamless RTO world • Tends to mask the tariff and contractual constraints of today • Makes wind appear more economic because fewer constraints lead to greater dispatch • Fifteen percent planning margin used may be conservative • Margin is calculated off nameplate • Covers generator forced outages and operating reserves that ABB MS does not model 2008 Base Case
Base Case Assumptions 2008 Base Case
System “Balloon” Diagram 2008 Base Case
Rocky Mountain Area Path & Ratings Diagram 2008 Base Case
Loads by Western Interconnect Region- 2008Based on WECC L&R Forecast issued in 2003, with RMATS modifications Annual GWh with Coincidental Summer & Winter Peaks (GW) Mexico - CFE NWPP-Canada Summer: 2.5 Winter: 2.2 Summer: 16.6 Winter: 20.3 14,425 California 130,743 Summer: 58.4 Winter: 44.8 NWPP-US 309,324 165,719 Summer: 24.1 Winter: 30.8 156,763 143,595 AZ, NM & S. NV Rocky Mt. States Summer: 31.2 Winter: 24.7 Summer: 24.6 Winter: 21.4 Load: 920,569 GWh Summer Peak: 157 GW 2008 Base Case
Loads by Rocky Mountain Area - 2008 Based on WECC L&R Forecast issued in 2003, with RMATS Modifications Annual GWh with Non-Coincidental Summer & Winter Peaks (MW) 2008 Base Case
Loads by Western Interconnect Region- HighBased on WECC L&R Forecast issued in 2003, with RMATS modifications (2013 load level) Annual GWh with Coincidental Summer & Winter Peaks (GW) Mexico - CFE NWPP-Canada Summer: 3.7 Winter: 3.4 Summer: 18.4 Winter: 23.2 19,896 California NWPP-US 143,129 Summer: 62.7 Winter: 48.4 Summer: 27.7 Winter: 36.0 336,861 193,696 162,952 161,138 AZ, NM & S. NV Rocky Mt. States Summer: 28.2 Winter: 23.6 Summer: 33.6 Winter: 25.4 Load: 1,017,672 GWh Summer Peak: 172 GW * 2013 loads applied to 2008 resources and transmission 2008 Base Case
Comparison Rocky Mountain Area Loads 2008 vs High Annual GWh with Non-Coincidental Summer & Winter Peaks (MW) 2008 Base Case
Gas Prices • Base case assumptions: • The 2008 US average Wellhead price set at $4.00 / MMBtu and at $5.00 / MMBtu • The basis differential is set to match the fifth Northwest Conservation & Electric Power Plan • For comparison, current 2008 Henry Hub Gas Future Price $4.70/MMBtu range (nominal $) $5.00 Case $4.00 Case * 50/50 is an average of STEP & NYMEX California prices include interstate pipeline charge of ~20¢ 2008 Base Case
Base Case Resource Additions- 2008 Incremental Additions 2008 Rocky Mountain Area Total Resources (MW) Total Capacity 29,121 MW • All plants in service by2006 • Does not include additional wind capacity of 1750 MW 2008 Base Case
Generation Capacity by Fuel Type (MW) WI Total: 192,646 MW RM Total: 29,121 MW • Does not include additional wind capacity of 1750 MW 2008 Base Case
Renewable Resources- 2008 Wind • Wind energy averages 34% capacity, NREL estimate 2008 Base Case
2008 High Wind Resource Sensitivity Assumptions • Added 1742 MW of Wind nameplate to base 508 MW for total of 2250 MW in the Rocky Mountain Area • Did not consider transmission impacts other than on monitored interfaces (feasibility may require significant transmission additions) • Wind MWhs displaced gas generation over 95% of time • Some hourly impacts on coal plants 2008 Base Case
Hydro Generation Is Consistent with SSG-WI High Low Final 2013 Alternatives Only Final 2013 Alternatives Only Base Case Run 2008 Base Case
Typical Thermal Resource Values Are Used Per Generation Technology / Age ($2004) 2008 Base Case
Planned Maintenance Outages • Values consistent with SSG-WI study • Updated outages to reflect a coordinated schedule • Model reduces dispatch for scheduled outages based upon user input for amount and time (% year, very approximate) Combined Cycle 7% CT 7% Coal Plant 10% Steam Oil/Gas 10% Nuclear 12% Geothermal 10% 2008 Base Case
Base Case Results • Locational Marginal Prices (LMPs) • Evaluation of Rocky Mountain (RM) Area Congested Paths • Western Interconnect Path Constraint Sensitivities • Evaluation of Potential Solutions • Plant Performance • Appendix
Base Case Observations • In concept, transmission congestion (bottlenecks) and losses cause differences in marginal prices at the nodal/bus level (LMPs) • In this modeling, transmission congestion drives differences in LMPs • LMPs are calculated separately for loads and generation • In the base case, the lowest LMPs for loads are at Laramie River, Colorado-West, and Yellowtail • Lowest LMPs for generation are at Laramie River, Colorado-West, and Bonanza • Indicates generation is bottled up • LMPs tend to decrease as relatively low cost resources are added • High wind capacity sensitivity is an example • Targeted transmission investments would levelize/stabilize marginal prices because congestion is relieved • Sensitivities were run to explore the change in VOM costs if constraints are removed – all constraints west-wide, constraints internal to the Rocky Mountain sub-region only, and constraints on Rocky Mountain import/export paths only • VOM cost savings would be significant and reach broadly • Such savings alone do not justify making investments, however. Investment costs and other factors must also must be considered 2008 Base Case
Base Case Observations • The top 5 congested paths in the Rocky Mountain sub-region are also export-related paths: • Idaho to Montana • TOT 2C • Bridger West • IPP DC • TOT 3 • The top 5 congested paths at $4 gas price are also the top 5 at $5 gas price • Dispatch ranking of plants is unchanged • Exception: high wind capacity sensitivity • Analysis includes a first look at opportunity costs (congestion costs) and potential solutions for three of the top 5 congested paths • Next steps: consider other alternative transmission solutions for 2008, determine capital costs, determine technical feasibility 2008 Base Case
LMP PricesAverage Annual 2008 Base Case
January 2008 Monthly Average LMP$4 Gas 2008 Base Case
June 2008 Monthly Average LMP$4 Gas 2008 Base Case
Jan 24, 2008 hr 03$4 Gas 2008 Base Case
Jan 24, 2008 hr 06$4 Gas 2008 Base Case
Jan 24, 2008 hr 07$4 Gas 2008 Base Case
Jan 24, 2008 hr 10$4 Gas 2008 Base Case
Jan 24, 2008 hr 14$4 Gas 2008 Base Case
Jan 24, 2008 hr 17$4 Gas 2008 Base Case
Jan 24, 2008 hr 24$4 Gas 2008 Base Case
June 12, 2008 hr 03$4 Gas 2008 Base Case
June 12, 2008 hr 06$4 Gas 2008 Base Case
June 12, 2008 hr 09$4 Gas 2008 Base Case
June 12, 2008 hr 12$4 Gas 2008 Base Case
June 12, 2008 hr 15$4 Gas 2008 Base Case
June 12, 2008 hr 18$4 Gas 2008 Base Case
June 12, 2008 hr 21$4 Gas 2008 Base Case
June 12, 2008 hr 24$4 Gas 2008 Base Case
Key RM Transmission Constraints$4 gas, 2008 loads, base case wind * $4 Gas- H load- $26,325; 12% 2008 Base Case
Opportunity Costs- RMATSSavings if increase path by 1 MW Sorted 2008 Base Case
Idaho to Montana Duration Curve S N 2008 Base Case
Idaho to Montana($4 gas, 2008 loads, high wind capacity)Base Case 2008 • Opportunity cost of not increasing the line by 1 MW: $19,047 • Forward limit (S – N): 337 MW • Reverse limit (N – S): -337 MW • Power flowing south is congested 3% of all hours S N Potential LineLoading represents that the interface was modeled with no constraints on all WI paths Blue line is reverse limit Black line is forward limit 1,042,362 MWh 1,373,642 MWh 576, 174 MWh/ 15% S N S N 2008 Base Case
TOT 2C Duration Curve N S 2008 Base Case
TOT 2C($4 gas, 2008 loads, high wind capacity) Base Case 2008 • Opportunity cost of not increasing the line by 1 MW: $20,341 • Forward limit (N – S): 300 MW • Reverse limit (S – N): -300 MW • Power flowing south is congested 23% of all hours N S 1,687,891 MWh 1,579,072 MWh 708,400 MWh/ 19% 40,864 MWh/ 1% N S N S 2008 Base Case