Download
1 / 43
460 likes | 1.35k Vues
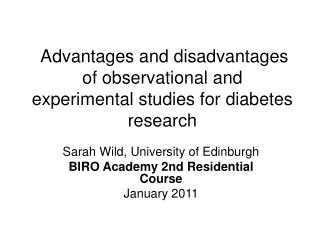
Advantages and disadvantages of observational and experimental studies for diabetes research. Sarah Wild, University of Edinburgh BIRO Academy 2nd Residential Course January 2011. Outline. Hierarchy of research evidence Advantages of trials Limitations of trials

E N D
Advantages and disadvantages of observational and experimental studies for diabetes research Sarah Wild, University of Edinburgh BIRO Academy 2nd Residential Course January 2011
Outline • Hierarchy of research evidence • Advantages of trials • Limitations of trials • Advantages of observational studies • Limitations of observational studies • Summary
Levels of evidencefor interventions • Evidence obtained from a systematic review of all relevant randomised trials. • Evidence obtained from at least one properly-designed randomised controlled trial. • Evidence from well-controlled trials that are not randomised; or well-designed cohort or case-control studies; or multiple time series (with or without the intervention). • Opinions of respected authorities; based on clinical experience; descriptive studies; or reports of expert committees.
Levels of evidence foranecdote-based medicine • Level I: Bearded old professor • Level II: Doctor with honest face • Level III: Researcher with mad stare • Level IV: Health service manager with afinancial crisis
Benefits of randomisation • Minimises confounding - known and unknown potential confounders that influence outcome are evenly distributed between study groups • reduces bias • guarantees treatment assignment will not be based on patients’ prognosis
Different effects of beta-carotene intake in cohort studies and trials Source: Egger and Davey Smith BMJ 1998; 316 : 140
Bias in RCTs Bias = systematic deviation from the truth Can underestimate or overestimate effects of an intervention • Selection/ allocation • Ascertainment/ loss to follow-up • Non-compliance • Publication
Selection bias and generalisibility of trials • older adults, women and ethnic minorities often under-represented in RCTs • RCTs are often performed in highly selected patient populations, eg those with typical features of a disease, without co-morbidities or those most likely to respond to the intervention • A median of 4% of participants with current asthma (range 0–36%) met the eligibility criteria for 17 major asthma RCTs Travers et al Thorax 2007;62:219-223
Comparison of trial and Lothian population based register data
Ascertainment biasBias from loss to follow-up • Occurs if people in one arm of trial are reviewed more frequently and outcomes are identified earlier and/or more frequently • Can result in lead time bias (ie apparent increase in survival following earlier diagnosis in one group) • Differences in completeness of follow-up between arms of trials may bias results
Non-compliance Efficacy vs effectiveness • Not all people will use treatment as allocated • May be differences between those that continue with allocated treatment and those that don’t • Exclusion of those who are not treated as planned introduces bias • Intention-to-treat analyses used to preserve randomisation and reduce bias
Effect of non-compliance • Non-compliance decreases power of study • Non-compliers differ from compliers eg in Physicians Health Study poor adherence (taking < 50% of study tablets) was associated with cigarette smoking, obesity, lack of exercise, and history of angina • In the placebo group better adherence was strongly associated with decreased risk of death
Publication bias – funnel plotsACEI/ ARB & risk of T2DM Source: Gillespie et al Diabetes Care 2005; 28 : 2261-2266
Maintaining randomisation • Principle 1 (Intention to treat) • Once a patient is randomised, his or her data should be analysed in the group randomised to - even if they discontinue, never receive treatment, or crossover. • Principle 2 (adequate follow-up) • “5-and-20 rule of thumb” • 5% probably leads to little bias • >20% poses serious threats to validity
Advantages of RCTs • Provide strongest and most direct epidemiologic evidence for causalityBUT • Non-blinded RCTs may overestimate treatment effects eg estimates of effect from trials with inadequately concealed allocation have been 40% larger than clinical trials with adequately concealed random allocation
Disadvantages of RCTs • More difficult to design and conduct than observational studies • ethical issues • feasibility • costs • Still some risk of bias and generalisibility often limited • Not suitable for all research questions
Limitations of trial design Trials may be • Unnecessary eg very effective intervention and confounding unlikely to explain effects (eg insulin for T1DM) • Inappropriate eg measurement of infrequent adverse outcomes, distant events • Impossible eg ethical issues if outcome harmful, widespread use of intervention, size of task • Inadequate eg limited generalisibility – patients, staff , care not representative Source: Black N et al BMJ 1996; 312 : 1215
Checking trial quality CONSORT • In 1996, a group of clinical epidemiologists, biostatisticians, and journal editors published a statement called Consolidation of the Standards of Reporting Trials (CONSORT) • Aimed to improve the standard of written reports of RCTs • Includes a checklist of 25 items and a flow diagram • Revised statement produced 2010: see http://www.consort-statement.org
Advantages of observational studies over trials • Cheaper • Larger numbers • Longer follow-up • Likely to be more generalisable because include more representative sample of population (or whole population) • Take place in normal health care settings • Efficient use of available data
Disadvantages of observational studies compared to trials • Non-randomised allocation to exposure of interest so strong likelihood of bias and confounding • Data more likely to be incomplete and of poorer quality • Outcomes less likely to be validated
Comparison of trials and primary care database data No adjustment for confounding Adjustment for available confounders Source: Tannen RL et al BMJ 2009; 338:b81
Attempting to reduce bias in observational studies • Adjusting for non-confounders • Propensity matching - considers and adjusts for the likelihood of a patient receiving one treatment rather than the other based on a number of pre-treatment factors. • Effective for some cases, but not all
Specific problems with meta-analysis of observational studies • Confounding and selection bias often distort the findings from observational studies and there is a danger that meta-analyses of observational data produce very precise but equally spurious results • See beta carotene example Source: Egger and Davey Smith BMJ 1998; 316 : 140
Different effects of beta-carotene intake in cohort studies and trials Source: Egger and Davey Smith BMJ 1998; 316 : 140
Quality of observational studies STROBE • STROBE stands for an international, collaborative initiative of epidemiologists, methodologists, statisticians, researchers and journal editors involved in the conduct and dissemination of observational studies, with the common aim of STrengthening the Reporting of OBservational studies in Epidemiology. • www.strobe-statement.org
Examples of use of observational data Source: Brownstein JS et al Diabetes Care 2010 ; 33 : 526-531
Metformin and cancer incidence • After adjusting for sex, age, BMI, A1C, deprivation, smoking, and other drug use HR for cancer incidence 0.63 (0.53–0.75) among 4,085 Scottish metformin users with 297 cancers compared with 4,085 non-metformin users with 474 cancers, median times to cancer of 3.5 and 2.6 years, • After adjusting for comorbidity, glargine and total insulin doses, exposure to metformin among people with type 2 diabetes treated with insulin, was associated with reduced incidence of cancer(OR 0.46 [0.25-0.85] (Italian n=112, N=1340, FU 76 months) Sources: Libby et al Diabetes Care 2009; 32:1620-1625 Monami et al Diabetes Care 2010; 33:1287-1290
Metformin and cancer mortality • In patients taking metformin compared with patients not taking metformin at baseline, the adjusted HR for cancer mortality 0.43 (95% CI 0.23–0.80) (Dutch n=122, N=1353, FU 9.6 yrs). • Cancer mortality in MF users similar to general population Source:Landman GWD et al Diabetes Care 2010; 33:322-326
Diabetes Rx and cancer incidence Retrospective cohort study of 62,809 people in the UK who developed diabetes >40 years of age, treated after 2000. 2106 people developed cancer HR compared to MF monotherapy • 1.08 (0.96-1.21) for MF+SU • 1.36 (1.19-1.54) for SU monotherapy • 1.42 (1.27-1.60) for insulin HR compared to insulin and no MF • 0.54 (0.43-0.66) for insulin +MF HR compared to untreated DM • 0.90 (0.79-1.03) for MF Source: Currie et al Diabetologia 2009;52:1766-1777
Diabetes Rx and cancer mortality • 10,309 new users for >1 year of metformin (MF) or sulfonylureas (SU) 1991-1996 with an average follow-up of 5.4 ± 1.9 years (means ± SD) identified from Saskatchewan Health administrative databases. Mean age 63.4 ± 13.3 years, 55% men. • Cancer mortality over follow-up was 4.9% (162 of 3,340) for SU monotherapy users, 3.5% (245 of 6,969) for MF users, and 5.8% (84 of 1,443) for insulin users After adjustment for age, sex, insulin use, co-morbidity HR for cancer mortality compared with the MF cohort • 1.3 [95% CI 1.1–1.6]; P = 0.012) for SU users • 1.9 (95% CI 1.5–2.4; P < 0.0001) for insulin users Source: Bowker et al Diabetes Care 2006: 29; 254-8
Were metformin users different? • Scottish study: MF users younger, more likely to be never smokers, higher BMI, higher HbA1c, less likely to use insulin, more likely to use SU than comparison group • Dutch: MF users shorter duration of DM, higher BMI, higher CV risk, lower insulin and SU use than non-MF users • UK: MF users younger, more likely to be female, shortest duration of diabetes, heavier, higher cholesterol, lower HbA1c, lower co-morbidity (CVD and cancer) • Canadian: SU users older with more men, MF users younger, more likely to be female, longer duration of treatment and more likely to receive insulin
Trials in progress • ENERGY: weight loss intervention to improve quality of life and reduce risk of recurrence for women with early stage breast cancer • Phase III Randomized Trial of Metformin Versus Placebo on Recurrence and Survival in Early Stage Breast Cancer Sources: http://clinicaltrials.gov/ct2/show/NCT01112839 http://clinicaltrials.gov/ct2/show/NCT01101438
Received: 29 Aug 2008 Accepted: 26 May 2009 Published online: 30 Jun 2009 Received: 5 Jun 2009 Accepted: 24 Jun 2009 Published online: 15 Jul 2009 Received: 26 May 2009 Accepted: 18 Jun 2009 Published online: 9 Jul 2009 Received: 19 May 2009 Accepted: 18 Jun 2009 Published online: 2 Jul 2009
Glargine and cancer – observational data Published Diabetologia Sept, 2009
What do these studies tell us? • Possible association between insulin and cancer • Metformin appears to offer protection • Long acting insulin analogue therapy associated with cancer in some studies • Short timescale suggests effect on cancer progression • Retrospective cohort studies are difficult to interpret accurately • effect of confounders • reverse causation • allocation bias/ confounding by indication • dose information rarely available
Further considerations for glargine papers • Small numbers (25 and 6 breast Ca in Swedish and Scottish studies respectively) • No association between glargine and breast cancer mortality in Swedish study • No association for glargine with other malignancy • Glargine exposure with other insulins not associated with malignancy • In Scottish study glargine alone users were older, more likely to have T2, be on OHAs, have high BP, higher HbA1c, had shorter duration of DM than other insulin users.Significant effect of confounders – crude HR for all cancers 2.6 and adjusted HR 1.7 • No adjustment for dose or duration of insulin use
Factors influencing diabetes treatment/ cancer association • Reverse causality – early symptoms of cancer may influence treatment of diabetes • Obesity: BMI/ adiposity/ fat distribution – MF more likley to be used in overweight/obese but weight increases with SU and insulin • Glycaemic control • Duration of diabetes and use of insulin • Smoking • Diet including alcohol • Physical activity • Socio-economic status • Ethnicity • Reproductive history • Cancer treatment (surgery, chemotherapy, radiotherapy)
Incident Cancers in Large Randomized Trials of Glucose Lowering. Gerstein, H. C. JAMA 2010;303:446-447
Intensive glycaemic control trials and cancer risk – meta-analysis • 222 Ca deaths in 53,892 person-years among intensively treated group and 155 Ca deaths in 38,743 person-years among usual care group • Risk ratios for cancer mortality: 1.00 (95% CI 0.81-1.24) for all 1.03 (95% CI 0.83-1.29) if exclude UKPDS MF • 357 incident Ca in 47,974 person-years among intensively treated group and 380 events in 45,009 person-years in control arm • Risk ratio for cancer incidence: 0.91 (95% CI 0.79-1.05) Source: Johnson et al Diabetologia. 2011 Jan;54(1):25-31
Mean weight increases in trials of intensive therapy to achieve glycaemic control
Aetiology of diabetes and cancer Environment Hyperinsulinaemia Obesity Poor control Treatment Treatment Cancer Death Insulin resistance Diabetes Good control Beta cell failure Genes
Summary • Well conducted RCTs are the optimum study design to test beneficial effects of treatment in a selected populations because they have the lowest risk of bias and confounding • Observational studies have a role to play in • generating hypotheses • investigating drug effectiveness in real world • describing rare, adverse outcomes in large populations BUT role of bias and confounding should be considered in the interpretation of findings
Further reading • A proposed method of bias adjustment for meta-analyses of published observational studies Thompson S et al Int. J. Epidemiol. (2010) doi: 10.1093/ije/dyq248 • Advancing the Science for Active Surveillance: Rationale and Design for the Observational Medical Outcomes Partnership Annals of Internal Medicine 2010 153:600-606 • When are observational studies as credible as randomised trials? Vandenbroucke JP. Lancet. 2004;363:1728-31. • Real-world effectiveness of new medicines should be evaluated by appropriately designed clinical trials Freemantle and Strack J Clin Epi 2010 63:1053-1058 • Commentaries on glargine papers eg Gale and Smith (Diabetologia 2009) Smeeth and Pocock (Lancet 2009)