Chemistry and Manipulating Numerical Data
150 likes | 269 Vues
This document explores the foundational role of numbers and measurements in chemistry and mathematics. It explains how exact numbers are derived from counting and definitions, detailing the importance of magnitude, uncertainty, and units in scientific measurements. Various graphical methods are discussed, such as bar graphs, pie charts, and line graphs, and their use in visualizing data trends and relationships. The guide emphasizes how to effectively read and interpret these graphs to convey scientific data and results clearly.

Chemistry and Manipulating Numerical Data
E N D
Presentation Transcript
Numbers Measurements • mathematics is based on numbers • exact numbers are obtained by: • - counting • - definition • science is based on measurements • all measurements have: • - magnitude • - uncertainty • - units
Bar Graph shows how many of something are in each category
1st Hour 2nd Hour 5th Hour 6th Hour 8th Hour Unit 1 Test – Honor’s ChemistryIntroduction to Chemistry 55 B’s 27 A’s 35 C’s Avg: 40.9 + 4.0 83.8 + 8.0 % 5 D’s 45 40 35 30 50 This is also about what the quarter grades will look like. September 14, 2007
Percentage of Weekly Income Pie Graph shows how a whole is broken into parts
Line Graph shows continuous change Stock Price over Time
Elements of a “good” line graph • axes labeled, with units • use the available space • title • neat
How to read a graph • Interpolate - read between data points • What volume would the gas occupy at a temperature of 150 K? • Extrapolate - read data beyond data points • What volume would the gas occupy at a temperature of 260 K? • Which do you have more confidence in? Why? 7 L (dependent variable) ~4 L (independent variable)
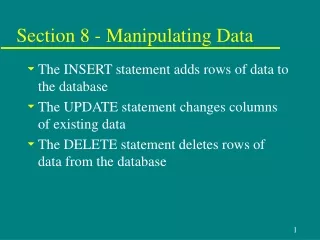
Graphs • Line Graph • Used to show trends or continuous change • Bar Graph • Used to display information collected by counting • Pie Graph • Used to show how some fixed quantity is broken down into parts
Line Graph How does the mass of a penny change with age? B A Mass (g) Mass (g) Age (Year of Penny) Age (Year of Penny) D C Mass (g) Mass (g) Age (Year of Penny) Age (Year of Penny)
Bar Graph Descriptive title Chemistry Grades Legend Number of Students Axis labeled (with units)
Reviewing ConceptsPresenting Scientific Data • How do scientists organize data? • How can scientists communicate experimental results? • What does a given point represent on a line graph? • The density of copper is 8.92 g/cm3. If you plotted the volume in cubic centimeters, what would the slope of the line be?