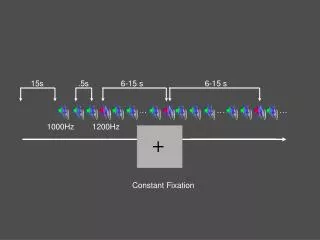
Fixation Disparity
Fixation Disparity. Fixation Disparity. Fixation disparity is a small error in the visual system. Occurs as a result of Panum’s fusional area Small error-minutes of arc 6 to 12 minutes of arc. Fixation Disparity. Depends of type of stimulus, larger for lower spatial frequencies.

Fixation Disparity
E N D
Presentation Transcript
Fixation Disparity • Fixation disparity is a small error in the visual system. • Occurs as a result of Panum’s fusional area • Small error-minutes of arc • 6 to 12 minutes of arc
Fixation Disparity • Depends of type of stimulus, larger for lower spatial frequencies. • Acts as stimulus for the vergence system • Balance between the convergence and divergence • Compensation for phoria • Accommodative inputs
Measuring Fixation Disaparity • Calculate fixation disparity • FD = 2a/2.9 x 10-4 x b/b • 2a=PD • b=target distance • b=difference between target distance and convergence distance • 2.9 x 10-4 = conversion factor from radians to min of arc
Can be measured at distance and near • Horizontal deviation • Vertical deviation • Uses nonius lines with a fusion lock • Takes advantage of vernier acuity
How Tests Work • Diagrams of Exo, Eso and Vertical • Change nonius lines to compensate for FD • Use prism to compensate for FD
Generating a forced vergence disparity curve • Put prism in place and measure the amount of fixation disparity • Associated phoria is the amount of prism needed to eliminate the fixation disparity • Y-axis is the amount of fixation disparity • X-axis is the amount of prism
Effect of Prism on FD • Base In prism • Base Out prism • Vergence movement
Types of fixation disparity curves • Type I • Type II • Type III • Type IV
What do the curves tell us? • Measure of vergence adaptation • Fast or disparity vergence system • Slow or vergence adaptation system
Vertical fixation disparity • Very little adaptation in this system
Spherical lenses • Moves curve up and down
Calculating AC/A ratio • For each lens power find the corresponding prism power that produces the same fixation disparity value • Plot each lens/prism pair of points
Analysis • Quadrant 1 • Quadrant 2 • Quadrant 3 • Quadrant 4
Characteristics of fixation disparity • Fixation distance
Saladin Vs Wesson Card • Ngan et al OVS (2005) • Compared the FD and associated phoria in adults using the Saladin and Wesson cards • Compared the y-intercept (FD) and x-intercept x-intercept.
Clinical application • Relationship to symptoms • Prism prescriptions • Effect of orthoptics