Download
1 / 50
500 likes | 769 Vues
Chapters 51-56. Intro to ecology. What is ecology?. Scientific study of interactions between organisms and their environment It starts at the level of individual, then population, then community (does NOT deal with the cellular level). Ethology. Biogeography.

E N D
Chapters 51-56 Intro to ecology
What is ecology? Scientific study of interactions between organisms and their environment It starts at the level of individual, then population, then community (does NOT deal with the cellular level)
Ethology Biogeography Study of animal behavior (think pillbug lab!) Fixed Action Pattern instinctive behavioral sequence; one of the few types of behaviors which was thought to be "hard-wired" and instinctive Study of past and present distribution of individual species
Behavioral Ecology • The branch of ecology that focuses on the evolutionary causes of variation in behavior among populations and species. • It is concerned with the adaptiveness of behavior, the ultimate questions of WHY animals behave as they do, rather than the proximate questions of how they behave.
Dominance Hierarchy • Dominance hierarchy arises when members of a social group interact, often aggressively, to create a ranking system. • In social living groups, members are likely to compete for access to limited resources and mating opportunities. • Rather than fight each time they meet, relative relationships are formed between members of the same sex. These repetitive interactions lead to the creation of a social order that is subject to change each time a dominant animal is challenged by a subordinate one.
Behavioral Biology- terminology Foraging – looking for food Habituation– a simple type of learning where an animal loses sensitivity to unimportant stimuli; this can increase fitness by allowing an animals nervous systems to focus on the important stuff Imprinting – also called attachment; learning that occurs during a specific time period and is generally irreversible; babies can imprint on whoever they think is their “mother” - ex. baby duckling following human; this bond usually lasts a lifetime Migrations– long-distance regular movements often involving round trips each year Courtship – behavior patterns that lead up to mating; often consists of a series of displays by one or both partners Pheromones- chemical signals commonly used by mammals and insects in reproductive behavior to attract mates and to trigger specific courtship behaviors; ex. Traveling behavior of ants and social/hive bees use pheromones to maintain order of the colony
Conditioning Many animals can learn to associate one stimulus with another Classical conditioning learning to associate an arbitrary stimulus with a reward or punishment Pavlov’s dog is a good example: Ivan Pavlov exposed dogs to a bell ringing and at the same time sprayed their mouths with powdered meat, causing them to salivate. Soon, the dogs would salivate after hearing the bell, even if they were not getting any powdered meat. Operant conditioning this is called trial-and-error learning—an animal learns to associate one of its own behaviors with a reward or a punishment and tends to repeat or avoid that behavior. Ex. if a dog sits, its gets a treat; a predator associates potential prey with painful experiences and then modifies its behavior accordingly
Altruistic Behavior and Kin Selection Altruism – behavior that reduces an individuals fitness but increases the fitness of the recipient; genes enhance the survival of themselves by directing the organism to assist others who share those same genes; people are more likely to help relatives, even if it means putting themselves at risk MOST behavior is selfish and NOT altruistic
Darwinian Fitness Recall that Darwinian Fitness is measured as the number of fertile individuals that are left in the next generation.
Kinesis vs. Taxis KINESIS is a change in activity or movement in response to a stimulus but the behavior is RANDOM. For example, a light goes on and bugs scatter randomly to the dark. TAXIS is movement toward or away from a stimulus. For example, bugs moving towards a food source or away from a predator.
Environment-two components Abiotic Biotic • Nonliving • Examples: • Temperature • Light • Water • Wind • Rock/Soil • Fire/Flood • Living organisms • Symbiotic relationships (predation/ mutualism/ etc) • Disease
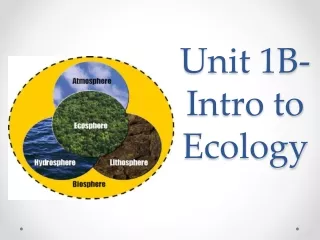
Levels of Organization MOST inclusive to LEAST inclusive: Biosphere Ecosystem Community Population Individual Population: Group of individuals of single species that occupies the same geographic area Community: All of the organisms of all of the species that exist in a certain area Ecosystem: all the biotic AND abiotic factors that exist in a certain area Biosphere: Global Ecosystem **Ecology does NOT deal with organisms on the CELLULAR level.**
Biogeography/Distribution • Biotic factors affect distribution of organisms(competition, predation, symbiosis, disease) • Abiotic factorsalso affect distribution(temp, light, etc as above) • ** Temperature has the greatest influence on the metabolic rate of plants/ animals • Distribution also affected by habitat selection(How organisms select habitat is not understood) • Photic/Aphotic zones of ocean
Photic vs. Aphotic Zones PHOTIC region of the aquatic biomes where light can penetrate; autotrophs live here - Main autotroph = Phytoplankton (PRODUCER- photosynthesis!) - Zooplankton (Primary Consumer) eat Phytoplankton APHOTIC region of aquatic biome where light CANNOT penetrate Photoperiod the period of time each day during which an organism receives light; also known as day length.
Estuary An estuary is the tidal mouth of a large river, where the tide meets the stream.
Savanna – Tropical grasslands with scattered trees; have both rainy and dry seasons; many times will have large animals grazing on the grasses; fires are common here Biomes Tropical Forests – Found near the equator so it gets a constant amount of sunlight/ temperature; lots of rain; huge diversity of species – both plant and animal; many of our medicines come from plants in the rainforest Desert- Low and unpredictable precipitation, may be hot or cold depending on location; animals here have adaptations to deal with the dry conditions
Temperate Grasslands – Maintained by fire, seasonal drought, and grazing by large animals; soils are deep and rich in nutrients Biomes Chaparral – Common along coastlines in mid-latitudes and have mild, rainy winters and hot, dry summers; dense and spiny evergreen shrubs are the dominant plantlife Temperate Deciduous Forests – Characterized by broad-leaved deciduous trees; have enough moisture to support the growth of these big trees; trees lose their leaves before winter; respond to different photoperiods
ALL terrestrial biomes show VERTICAL STRATIFICATION. Biomes Coniferous Forests (Taiga) – Characterized by harsh winters and heavy snowfall; coniferous trees grow in dense, uniform areas; SHORTEST growing season Tundra – Northernmost limit of plant growth; characterized by dwarf and mat-like vegetation The TWO major factors in determining the distribution of organisms (or in delimiting biomes): Poles Temperature Equator Precipitation (Water)
Vertical Layering (Stratification) • Vertical layering of a habitat or the arrangement of vegetation in layers. • It classifies the layers of vegetation largely according to the different heights to which their plants grow. • The individual layers are inhabited by different animal and plant communities. • Canopy the canopy of the tropical forest is the top layer covering the layers below • Permafrost found in the tundra; permanently frozen stratum that lies under ground
Population DensityBirth and Death Rates • In order to calculate change in population, you can just do birth-death rates. Let’s try a problem: SAMPLE A population of groundhogs has an annual per capita birth rate of 0.08 and a per capita death rate of 0.05. Estimate the number of individuals added to (or lost from) a population of 100 individuals in one year. 0.08 – 0.05 = 0.03 = 3% .03 x 100 = 3 individuals added to the population
Population DensityBirth and Death Rates • Practice Problems: • A population of squirrels has an annual per capita birth rate of 0.05 and a per capita death rate of 0.07. Estimate the number of individuals added to (or lost from) a population of 500 individuals in one year. • A population of rabbits has an annual per capita birth rate of 0.09 and a per capita death rate of 0.05. Estimate the number of individuals added to (or lost from) a population of 1000 individuals in one year.
Population DensityBirth and Death Rates - ANSWERS • Practice Problems: 1. A population of squirrels has an annual per capita birth rate of 0.05 and a per capita death rate of 0.07. Estimate the number of individuals added to (or lost from) a population of 500 individuals in one year. 0.05 – 0.07 = -0.02 500 x -0.02 = -10 individuals So 10 individuals lost each year 2. A population of rabbits has an annual per capita birth rate of 0.09 and a per capita death rate of 0.05. Estimate the number of individuals added to (or lost from) a population of 1000 individuals in one year. 0.09 – 0.05 = .04 1000 x 0.04 = 40 individuals So 40 individuals added each year
Population DensityMark and Recapture In order to estimate the population size of a group of organisms, scientists can use the Mark and Recapture method. The basic process is: - Capture as many individuals as you can, count them, and mark them - A certain amount of time later, recapture as many individuals as you can and count them. Also, count how many of those were marked. - Calculate the population size using the following equation: N = snN = population size x s = # marked in the 1st sampling n = total # captured in the 2nd sampling x = # marked in 2nd sampling
Mark and Recapture MethodPractice Problems 1. If we capture 100 birds, mark them, then release them, and we come back the next day and capture 120 more…but 20 had already been marked, what is the estimated population? 2. We caught, marked and released 200 butterflies. The next day, we came back and caught 160. Of those 160, 40 were marked. What is the estimated population size? N = snN = population size x s = # marked in the 1st sampling n = total # captured in the 2nd sampling x = # marked in 2nd sampling
Mark and Recapture MethodPractice Problems - ANSWERS 1. If we capture 100 birds, mark them, then release them, and we come back the next day and capture 120 more…but 20 had already been marked, what is the estimated population? N = (sn)/x N = (100 x 120) / 20 (12000)/20 600 2. We caught, marked and released 200 butterflies. The next day, we came back and caught 160. Of those 160, 40 were marked. What is the estimated population size? N = (200 x 160) / 40 (32000)/40 800 N = snN = population size x s = # marked in the 1st sampling n = total # captured in the 2nd sampling x = # marked in 2nd sampling
Survivorship Curves A survivorship curve shows the number of individuals, or proportion, still alive in a population at each age. There are 3 types: - Type I low mortality during early and middle age and a rapid increase in old age; typical in populations that produce relatively few offspring and provide parental care; Ex. Humans who live in developed countries - Type II death rate is relatively constant throughout a lifespan - Type III typical of populations that produce many offspring, most of which die off rapidly; the few offspring that survive are likely to reach adulthood This kind of curve is impossible – it can’t go down and then go back up
Exponential Population growth model Population growth under ideal conditions Assumes unlimited resources (does NOT take into consideration carrying capacity) “J” shaped curve Population Growth The human population shows this kind of growth due to: - improved sanitation - vaccinations/ pesticides - better nutrition
Intrinsic Rate of Increase • The rate at which a population increases in size if there are no density-dependent forces regulating the population is known as the intrinsic rate of increase. • The theoretical maximum rate of increase of a population per individual. The concept is commonly used in insect population biology to determine how environmental factors affect the rate at which pest populations increase. • J shaped curve
Population Growth N – population size K – carrying capacity Logistic population growth model Does not assume unlimited resources (like exponential); takes into consideration carrying capacity Incorporates effect of population density on rate of increase “S” shaped curve Carrying capacity= maximum population size a particular environment can support with the available resources at particular time w/ NO degradation of habitat “K”=carrying capacity Factors include: energy, shelter, soil nutrition, water, nesting sites, etc. The LOGISTIC EQUATION says that as N approaches K, the GROWTH RATE will decrease and approach zero
Selection for life history traits • K - selection (DENSITY DEPENDENT) • Maximize population size in a population living near carrying capacity • Few offspring, parental care; Ex. humans • Humans • S-shaped curve • R - selection (DENSITY INDEPENDENT) • Found in un-crowded environments – so the population is lower than carrying capacity and there is little competition; can occur in disturbed habitats • The RATE OF INCREASE is HIGH in the population • High repro. rate ; produce many/ small offspring; high mortality of offspring; LITTLE parental care ; Ex. frogs • J-shaped curve ALL POPULATIONS of the SAME SPECIE show either R- or K- selection
Negative feedback: The death rate increases as the population density increases, so this prevents unlimited population growth This affects DENSITY- DEPENDENT (S-curve; logistic model) populations because they often fall close to the carrying capacity. DENSITY–INDEPENDENT populations (J-curve; exponential model) are NOT affected by negative-feedback.
Ecology concepts • Community- assemblage of populations in an area or habitat • Ecological niche-an organisms interaction with the biotic and abiotic resources in the environment • How is “fits into” an ecosystem (what is its “job”) • Competitive Exclusion Principle no two species can occupy the same niche
Effect of Fire on Communities • Fire can have an integral role in recycling dead plant matter and allowing those nutrients to become more available. Many ecosystems, particularly prairie, savanna, chaparral and coniferous forests, have evolved with fire as a contributor to habitat vitality and renewal. Many plant species in fire-affected environments require fire to germinate, establish, or to reproduce. • Fire suppression can lead to the build-up of flammable debris and the creation of less frequent but much larger and more destructive wildfires. • Recent ecological research has shown that fire is an integral component in the function and biodiversity of many natural habitats, and that the organisms within these communities have adapted to withstand, and even to exploit, natural wildfire. More generally, fire is now regarded as a 'natural disturbance', similar to flooding, wind-storms, and landslides, that has driven the evolution of species and controls the characteristics of ecosystems.
Succession Primary vs. Secondary Succession
Symbiosis Predation-predator/prey; can lead to adaptations (coloration etc); benefits one organism, harms the other Parasitism - benefits one organism (parasite) and harms the other (host); the parasite lives in or on the host; Ex. can be in animals (tapeworms) OR can be in plants smaller plants live on larger trees and take the nutrients away from the larger trees (smaller plant gets the nutrients, bigger tree is harmed b/c it is losing nutrients)
Mutualism- benefits both species; Ex. Oxpecker (bird) and the rhinoceros or zebra the bird lands on rhinos or zebras and eat ticks and other parasites that live on their skin. The birds get food and the beasts get pest control Commensalism- interaction benefits one species; does not affect the other; Ex. barnacles living on a whale barnacles get a habitat where nutrients are available from the water, but this does not help or hinder the whale
Mullerian Mimicry Coloration and Mimicry Coloration – Animals that are typically prey can sometimes use coloration as a defense. If the organism has colorations that help it blend into the background, it is called cryptic coloration. If they are brightly colored and stand out to ward their predators that they are harmful, that is called aposematic coloration. Mimicry – Batesian mimicry harmless or good-tasting species mimic a harmful or gross tasting one so that the predators think it will not be good to eat Mullerian mimicry two animals that are BOTH harmful mimic each other so that there are more of the “bad” organisms in the community – this way the predators learn faster not to eat them In order for mimicry to work, both organisms have to be in the SAME geographic area Cryptic Coloration
Food Chains All food chains must start with a PRODUCER (autotroph). The organism that eats the producer is called the PRIMARY CONSUMER. If they only eat plants, they are also called herbivores. An animal that eats a primary consumer is called a SECONDARY CONSUMER. If that animal eats only meat, they are called a carnivore. If an animal eats both plants and meat, they are omnivores. The Dynamic Stability Hypothesis says that long food chains are less stable than short chains, and population fluctuation magnified at higher levels. Remember, less than 20% of energy is passed from one trophic level to the next, so food chains are kept relatively SHORT.
Food chain- transfer of food between trophic levels (level of consumption); only LESS THAN 20% of energy is passed on to next level (usually about 10%) • TROPHIC EFFICIENCY % of production transferred from one level to the next • Food web- summarizes trophic relationships in a community ; more realistic than a food chain; MAKE SURE YOU ARE ABLE TO IDENTIFY WHERE THE PRODUCER IS AND WHERE THE CONCENTRATION OF TOXINS WOULD BE HIGHEST (at the highest consumer!!)
Introduced Species • Definition = a species living outside its native distributional range; humans put the organism there either on purpose or accidently • Effects introduced species can have: • Competes with native species for resources • Displaces native species • Preys on native species • Reduces biodiversity • Only about 10% of introduced species actually survive and thrive in the new location This is called the Ten’s Rule
Keystone Species • A keystone speciesis a species that has a disproportionately large effect on its environment relative to its abundance. Such species are described as playing a critical role in maintaining the structure of an ecological community, affecting many other organisms in an ecosystem and helping to determine the types and numbers of various other species in the community. • An ecosystem may experience a dramatic shift if a keystone species is removed, even though that species was a small part of the ecosystem by measures of biomass or productivity.
Primary Production in Ecosystems • Energy will flow NOT cycle thru ecosystem • Comes in as light energy and leaves as heat • Production efficiency • Fraction of food energy NOT used for respiration • Herbivores consume only a fraction of the plant material produced; they can’t digest all they eat; and much of that energy is used for respiration • Trophic efficiency • Percentage of production transferred from one trophic level to the next • Usually between 10-20%
Primary Production in Ecosystems • Gross-GPP, is the total amount of light energy converted to chemical energy…the organisms photosynthetic output • Net-NPP, is the net amount of primary production after the costs of plant respiration are included. • Therefore, NPP = GPP - R
Humans • Humans show K- selection (density dependent), show a type I survivorship curve, have a relatively small family size, and show a relatively even age structure • Humans- widespread agents of community disturbance • Reduces species diversity • Humans are the BIGGEST THREAT TO BIODIVERSITY • 4 major threats to biodiversity: • Habitat destruction • Introduced species • Overexploitation (overharvesting) • Disruption of food chains
Humans Impact the Biosphere in several ways: • Agriculture (interfering with nutrient recycling) • Eutrophication • Acid Precipitation • Toxic compounds (DDT, PCM) • CO2 (greenhouse, global warming) • Habitat destruction
Eutrophication Eutrophicationis characterized by an abundant accumulation of nutrients (sewage, factory wastes, fertilizer, etc) that causes a dense growth of algae and cyanobacteria (blooms!). The presence of these organisms (and their respiration) leads to an oxygen shortage in the rest of the water, and that lack of O2 kills off many fish and animals.
Acid Rain Acid rain is defined as rain, snow, or fog with a pH less than 5.6. Burning wood and coal releases oxides of sulfur and nitrogen which can form nitric acid in the atmosphere. These acids return to the earth in acid rain, which can change soil chemistry. This change can lead to damage in forests and also lakes.
Toxic Compounds Many toxic chemicals dumped into ecosystems are non-biodegradable; some may become more harmful as they react with other environmental factors. Organisms absorb these toxins from food and water and may retain them within their tissues. Chlorinated hydrocarbons, such as DDT, and polychlorinated biphenyls, or PCBs, have been implicated in endocrine system problems in many animal species. In a process known as biological magnification, the concentration of such compounds increases in each successive link of the food chain.
The phenomenon whereby the earth's atmosphere traps solar radiation, caused by the presence in the atmosphere of gases such as carbon dioxide, water vapor, and methane that allow incoming sunlight to pass through but absorb heat radiated back from the earth's surface. The Greenhouse Effect CO2 is the MAIN greenhouse gas.
Global Warming Global Warming is an increase in the earth's average atmospheric temperature that causes corresponding changes in climate. This may result from the greenhouse effect.