Interaction Design Direct Manipulation
This document explores the dimensions of interaction styles in user interface design, focusing on direct manipulation as a method of enhancing user experience. It highlights various interaction dimensions such as initiation of dialogues, flexibility, degree of automation, complexity of action and perception spaces, and the relationship between interaction styles and user types. Key references, including foundational works by Mayhew and Rauterberg, provide insights into effective design strategies, emphasizing the balance between flexibility and user familiarity.

Interaction Design Direct Manipulation
E N D
Presentation Transcript
Interaction DesignDirect Manipulation Prof. Dr. Matthias Rauterberg Faculty Industrial Design Technical University Eindhoven g.w.m.rauterberg@tue.nl 04-DEC-2002
Key references/literature: D.J. Mayhew (1992) Principles and guidelines in software user interface design. Prentice Hall. chapter 9: dialog styles - direct manipulation. ISO/FDIS 9241 (1997) Ergonomic requirements for office work with visual display terminals (VDTs). Part 16: direct-manipulation dialogues. (c) M. Rauterberg, TU/e
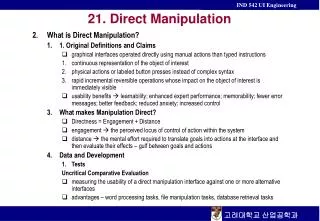
Dimensions of interaction styles • Initiation • Degree to which initiation of the dialogue rests with the computer or the human user. • Dialogue flexibility • number of ways in which a user can perform given functions. • Degree of automation • Amount of work accomplished by the system in response to a single user command. • Complexity of action space • Number of different options available to the user at any given point in the dialogue. • Complexity of perception space • Degree to which the interactions absorbs the memory and reasoning power of the user. • Interaction style and user type [taken from Smith, 1997] (c) M. Rauterberg, TU/e
SketchPad, Ivan Sutherland, MIT, 1963 (c) M. Rauterberg, TU/e
First Mouse D. Engelbart & W. English, 1964 NLS, Douglas Engelbart, Stanford Research Institute, 1968 (c) M. Rauterberg, TU/e
Star, Xerox, 1981 (c) M. Rauterberg, TU/e
Lisa Desktop, Apple, 1982 (c) M. Rauterberg, TU/e
A Web Community, eBay, 1990s (c) M. Rauterberg, TU/e
The interface architecture (c) M. Rauterberg, TU/e
Three different function types Secondary functions [dialog manager] Tertiary functions [dialog manager] Primary functions [application manager] Application object(s) (c) M. Rauterberg, TU/e
The function space [taken from Rauterberg, M. (1996). An empirical validation of four different measures to quantify user interface characteristics based on a general descriptive concept for interaction points. Proceedings of IEEE Symposium and Workshop on Engineering of Computer-Based Systems (IEEE Order Number: PR07355, pp. 435-441). IEEE Computer Society Press] (c) M. Rauterberg, TU/e
Two dimensions for interaction [taken from Rauterberg, M. (1996). A concept to quantify different measures of user interface attributes: a meta-analysis of empirical studies. Proceedings of IEEE International Conference on Systems, Man and Cybernetics--SMC'96 (vol. 4, IEEE Catalog Number: 96CH35929, pp. 2799-2804) IEEE Press] (c) M. Rauterberg, TU/e
How to measure? [taken from Rauterberg, M. (1996). Quantitative Test Metrics to Measure the Quality of User Interfaces. In: Proceedings of Fourth European Conference on Software Testing Analysis and Review--EuroSTAR'96 (pp. TQ2P2/1 - TQ2P2/13). Amsterdam] (c) M. Rauterberg, TU/e
How to design Desktop Interfaces (DI)? • Menu structure (I.e. pull-down menus) • discrete and partially continuous actions • WIMP = Windows, Icons, Mouse, Pointing • ‘desktop’ is NOT ‘direct manipulation’ • the ‘desktop’ metaphor does NOT fit to all application domains (c) M. Rauterberg, TU/e
Desktop: example (1) (c) M. Rauterberg, TU/e
Desktop: example (2) (c) M. Rauterberg, TU/e
Desktop Interface (1): advantages • Easy to learn and remember • Direct, intuitive, "wysiwyg": allows user to focus on task semantics rather than on system semantics and syntax • Flexible, easily reversible actions • Provides context and instant, visual feedback • Exploits human use of visual/spatial cues and motor behaviour • Low typing requirements and visual feedback means less opportunity for user input error (and less error messages) (c) M. Rauterberg, TU/e
Desktop Interface (2): disadvantages • Can be inefficient for high frequency experts, especially touch typist, and when there are more actions and objects than can be fit on one screen • may be difficult to design recognizable icons for many objects and actions (‘what is it’ versus ‘where is it’) • icons take more screen ‘real estate’ than words (c) M. Rauterberg, TU/e
Desktop Interface (3) Most appropriate for: • Knowledge and experience • low typing skills • low system experience • low task experience • low application experience • high frequency of use of other systems • low computer literacy • job and task characteristics • low frequency of use • little or no training • discretionary use • high turn over rate • low task importance • low task structure (c) M. Rauterberg, TU/e
Desktop Interface (4) Guideline: accompany icons with names (c) M. Rauterberg, TU/e
Desktop Interface (5) Guideline: choose appropriate windowing strategy (c) M. Rauterberg, TU/e
Desktop Interface (6) • Windowing uses: • quick context switching with place-saving • work in one, monitor another • cut and paste • compare • show more detail, preserve context • give command, see results • get HELP, preserve context • display same object in different forms • Windowing types: • system-controlled • user-controlled, tiled • user-controlled, overlapping (c) M. Rauterberg, TU/e
Desktop Interface (7) Windowing: experimental study [S.E. Davies, K.F. Bury and M.J. Darnell (1985) An experimental comparison of a widowed vs. a non-windowed operating system environment. Proceedings of the Human Factors Society 29th Annual Meeting, pp. 250-254] (c) M. Rauterberg, TU/e
Desktop Interface (8) Windowing: experimental study [K. Gaylin (1986) How are window used? Some notes on creating an empirically based windowing benchmark task. Proceedings CH’86, ACM, pp. 96-100]] (c) M. Rauterberg, TU/e
Desktop Interface (9) Windowing: experimental study [S.A. Bly and J.K. Rosenberg (1986) A comparison of tiled versus overlapping windows. Proceedings CHI’86, ACM, pp. 101-106] (c) M. Rauterberg, TU/e
Desktop Interface (10) • Windowing design guidelines: • design easy to use and learn window operations (complexity of windowing interfaces should NOT cancel out advantages). • minimise the number of window operations necessary to achieve a desired effect. • make navigation between windows particularly easy and efficient to do. • make setting up windows particularly easy to remember. • provide salient visual cues to identify ‘active’ window. • provide a consistent ‘user model’ of windows (window is an object OR workspace OR dialog box). • allow overlapping when displays are unpredictable, screens are small, and users are fairly frequent and experienced. • in overlapping windowing, provide powerful commands for arranging windows on the screen in user-tailorable configurations. (c) M. Rauterberg, TU/e
Historical Trends for Icon Design • Four different levels of abstraction can be found over the last 80 years. • Actual icons get more abstract compared to the past. (c) M. Rauterberg, TU/e
The Meaning of Icons • The numbers in the table mean the percentage of all collected answers; each intended answer is underlined. • [see Caron, J.P., Jamieson, D.G. & Dewar, R.E.: Evaluating pictograms using semantic differential and classification technique. Ergonomics 23(2), 1980, p. 142] (c) M. Rauterberg, TU/e
The Icon Set for Marshalling Signals • [ redrawn from Henry Dreyfuss, Symbol Sourcebook (New York, 1972), p. 152] • See the wonderful analysis of this icon set and the recommended redesign in the marvelous book of Edward R. Tufte (Envisioning Information, 1990, Graphics Press) on page 63. (c) M. Rauterberg, TU/e
Redesign of Icons (1) • Design Principle: • avoid excessive detail in icon design. • [see Deborah J. Mayhew, Principles and Guidelines in Software User Interface Design (1992) pp.316-331] (c) M. Rauterberg, TU/e
Redesign of Icons (2) • Design Principles: • design the icons to communicate object relations and attributes whenever possible; • accompany icons with names. • [see Deborah J. Mayhew, Principles and Guidelines in Software User Interface Design (1992) pp.316-331] (c) M. Rauterberg, TU/e
[taken from Dominic Paul T. Piamonte (2000): Using Multiple Performance Parameters in Testing Small Graphical Symbols. Doctoral thesis, Institutionen för Arbetsvetenskap Avdelningen för Industriell ergonomi.• ISSN: 1402-1544] (c) M. Rauterberg, TU/e
Recognition rates in percent (first rows, bold-faced: above 67%) and certainty ratings (second rows) for the 23 Referents by subjects from Philippines and Sweden (N=100). Note: Phil. = Philippines, Swed. = Sweden.[taken from Dominic Paul T. Piamonte (2000): Using Multiple Performance Parameters in Testing Small Graphical Symbols. Doctoral thesis, Institutionen för Arbetsvetenskap Avdelningen för Industriell ergonomi. • ISSN: 1402-1544 • ISRN: LTU-DT--00/02--SE] (c) M. Rauterberg, TU/e
Graphical symbols used in the main studies as based on Böcker (1993) for the European Telecommunications Standards Institute (ETSI, 1993). Best videophone symbols when combining hit rates, false alarms (confusions) and missing values (no answers), per country. Numbers indicate Symbol Set. (c) M. Rauterberg, TU/e
Benefit visual representation high concrete textual representation representation low low high User’s knowledge and experiences in application domain (c) M. Rauterberg, TU/e
Information types States person sleeping descriptive features of a computer relationships similarity between twins spatial dimensions of a room discrete action switch light on continuous action ski turn events start of a race procedural repair photocopier causal how an engine works states evidence is uncertain descriptive person’s belief relationships classes of religious belief values prime numbers discrete action choosing to agree/disagree continuous action monitoring success procedural diagnosing a fault causal explanation of gravity static physical dynamic static conceptual dynamic (c) M. Rauterberg, TU/e
Media selection and combination (c) M. Rauterberg, TU/e
Examples for media design [taken from Rauterberg, M. (1998). About the importance of auditory alarms during the operation of a plant simulator. Interacting with Computers, vol. 10(1), pp. 31-44] (c) M. Rauterberg, TU/e
Feedback of system status information (c) M. Rauterberg, TU/e
Desktop Interface: design guidelines • provide alternative interface for high frequency, expert user • choose a consistent icon design scheme: • depict ‘before and after’ • depict tool • depict action • accompany icons with name/labels • provide visual feedback for position, selection and movement, and physical feedback for modes! (c) M. Rauterberg, TU/e
Summary (1) (c) M. Rauterberg, TU/e
Summary (2) (c) M. Rauterberg, TU/e
Summary (3) (c) M. Rauterberg, TU/e
Summary (4) (c) M. Rauterberg, TU/e
How to design Direct Manipulation (DM)? • Icons and pop-up menus • Natural mappings • mostly analogue and continuous actions • context awareness of the system about user’s situation (c) M. Rauterberg, TU/e
Direct manipulation interface (c) M. Rauterberg, TU/e
Direct manipulation interaction (c) M. Rauterberg, TU/e
Trends in User Interface Technology Ubiquitous and Mobile computing Ambient rooms and Cooperative buildings (c) M. Rauterberg, TU/e
Head-up Displays in Cars • More information and less distractionInformation on the state of the road, on the speed of the vehicle in front (supplied by the intelligent cruise control), on obstacles lying around the next bend in the road identified by the remote detection system, or direction arrows sent by the driver guidance system... drivers will be receiving more and more information from "intelligent" vehicle systems. Although the information is intended to enhance safe driving, there is a danger that an abundance of information may produce the opposite effect if driver glance-away time has to increase in order to apprehend the data. (c) M. Rauterberg, TU/e
Electronic Performance Support System • Food processing plant worker with a first-generation prototype wearable computer. • Possible applications include support for quality control data collection or assistance with environmental auditing. • This system gives its users the information the users need to perform a task as they actually perform the task. (c) M. Rauterberg, TU/e