Download
1 / 5
50 likes | 165 Vues
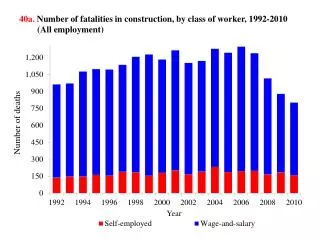
40a . Number of fatalities in construction, by class of worker, 1992-2010 (All employment). 40b . Distribution of construction employment and fatalities, by establishment size, 2010 (Wage-and-salary workers).

E N D
40a. Number of fatalities in construction, by class of worker, 1992-2010(All employment)
40b. Distribution of construction employment and fatalities, by establishment size, 2010(Wage-and-salary workers) This research was conducted with restricted access to Bureau of Labor Statistics (BLS) data. The views expressed here do not necessarily reflect the views of the BLS.
40c. Rate of nonfatal injuries resulting in days away from work in construction, by establishment size, 1994-2010(Private wage-and-salary workers) OSHArevisedrequirements
40d. Rate of fatalities in construction, by state, 2008-2010 average(All employment)
40e.Rate of nonfatal injuries resulting in days away from work in construction, by state, 2008-2010 average(Private wage-and-salary workers)