Download
1 / 12
120 likes | 238 Vues
Obesity clusters within the Empire Health Foundation Region. Joe Campo, MPH Healthcare Research Group Office of Financial Management Highlights of November 17 th , 2011, presentation. Identifying clusters.

E N D
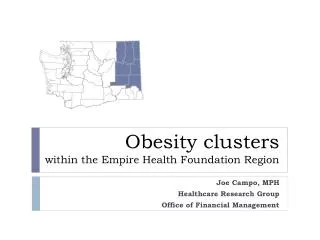
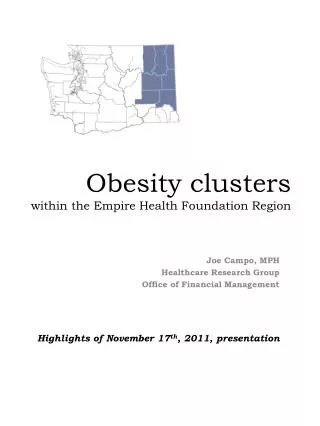
Obesity clusterswithin the Empire Health Foundation Region Joe Campo, MPH Healthcare Research Group Office of Financial Management Highlights of November 17th, 2011, presentation
Identifying clusters Obesity is on the rise nationally and locally – with broad consequence affecting quality of life and longevity as well as cost to the health care system as a whole. Using cluster identification software from the National Cancer Institute, together with Behavioral Risk Factor Surveillance System (BRFSS) data for 2003 through 2010, three regions were identified within the Empire Health Foundation (EHF) Region as having higher than expected obesity rates. These high obesity clusters include most of Adams County, portions of Lincoln and Stevens Counties, and the northern portion of Spokane City. An area with lower than expected obesity rates was also identified; this area comprises most of the southern portion of Spokane County. High & low obesity clusters brfss 2003-2010 Trends within each of these cluster areas, as well as for the EHF Region as a whole, were also assessed. For the Adams and Lincoln/Stevens clusters, no significant trends were identified, although the lines that best fit each of those areas’ obesity rates are moving upwards. For North Spokane City, there had been a significant upward trend (7% per year) from 2003 to 2008; however, in 2009 and 2010 the rates in that area are markedly lower. Surprisingly, within the low obesity cluster, South Spokane County, the rates are increasing over time at 4% per year. So, too, within the EHF Region as a whole the obesity rates are also increasing at 3% per year. Obesity clusters within the Empire Health Foundation Region November 2011
Hospitalizations – Rates Age-adjusted inpatient day hospitalization rates, for 2005 to 2009 combined, were analyzed for conditions known to be associated with obesity. These rates were based upon the patients’ reported ZIP code of residence, not where the hospital was located. Rates for diabetes as the primary or secondary diagnosis within each of the high obesity clusters were higher than the EHF Region’s rate; in the low obesity cluster, they were lower. For coronary artery disease (CAD), rates within the high obesity Adams and Lincoln/Stevens clusters were higher than the EHF’s Region's rate; in the low obesity South Spokane County cluster they were lower. Somewhat surprisingly, the rates in the high obesity North Spokane City cluster were borderline low compared to the EHF Region. However, the rates in each of the high obesity clusters were higher than the rate in the low obesity one. Rates for stroke were markedly high in Lincoln/Stevens clusters. Similarly, rates for hypertension were markedly high in the Adams cluster. Obesity clusters within the Empire Health Foundation Region November 2011
Hospitalizations – Trends Trends for these hospitalization rates were also assessed. For diabetes, however, no significant trends were identified for any of the clusters or the EHF region as a whole; the rates are essentially remaining flat over time. Conversely, for CAD, trends were seen in each cluster and for the region as a whole. In all instances those rates were decreasing, although at varying rates. Within the EHF Region, CAD rate are decreasing at close to -6% per year. In the South Spokane County, they are decreasing at a lower rate, approximately -4% per year. The rates are decreasing at -3% per year within the North Spokane City cluster, -6% per year in Adams, and about -5% per year in Lincoln/Stevens. For stroke, the rates within the EHF Region are decreasing at -6% per year. They are decreasing in Lincoln/Stevens by -21% per year. The rates in North Spokane City , however, have been increasing by 12% per year starting in 2005. Hypertension is increasing in South Spokane County – at 10% per year. No trends are seen elsewhere. Obesity clusters within the Empire Health Foundation Region November 2011
Hospitalizations – Costs Excess costs or savings were also estimated for hospitalizations associated with obesity. These were derived by converting all reported hospitalization charges to “costs” using the Agency for Healthcare Research and Quality’s (AHRQ) cost-to-charge ratios, estimating the number of patient days that would be generated in each cluster if the populations living those clusters had been hospitalized at the same rate they were within the EHF Region, comparing those “expected” patient days to the actual days generated, multiplying any differences in days by the EHF Region’s cost per day, dividing that product by the population in each cluster, and then multiplying the results by 1,000 to generate an estimated excess cost or saving per 1,000 person within each cluster. For instance, because the hospitalization rate for diabetes in the South Spokane County cluster is lower than the rate in the EHF Region, the saving there equals about $35,000 per 1,000 persons per year compared to what it would have cost had they been hospitalized at the same rate as seen for the region as a whole. In Lincoln/Stevens the excess hospitalization rates equal an excess cost of $40,000 per 1,000 persons per year for diabetes. Obesity clusters within the Empire Health Foundation Region November 2011
Characteristics of the population Various behavioral and demographic characteristics of each cluster area were also assessed. Included, below, are measures pertaining to exercise, diet, insurance coverage, education, income and race. Obesity clusters within the Empire Health Foundation Region November 2011
Characteristics of the environment A community’s access to healthy food is one factor to consider in assessing the role environment plays in promoting or preventing obesity. The map below is based upon data provided by the CDC showing the percent of health food retailer in a tract relative to all food retailers in that tract including quickie-marts and fast food vendors. Overlaid on the map are selected cities within the EHF Region. Also overlaid on the map are the high obesity clusters identified through BRFSS. While no rigorous assessment has been done on the correlation between the obesity clusters and the regions with poor access to healthy food retailers, a scan of the map suggests that both Springdale and Ritzville differ from the other cities shown in that they both are within regions with relatively poor access to healthy food retailers. Obesity clusters within the Empire Health Foundation Region November 2011
What the future may hold Factors that lead to obesity may be traced back to early youth – or younger. In that context, we examined hospitals birth data, as well as the school-based Healthy Youth Survey data. For hospital-based births, a concerning harbinger was seen in assessing macrosomia, or large-baby births; these newborns may be at greater risk for adult obesity than normal weight ones. Surprisingly, the low obesity South Spokane County had the highest macrosomia birth rate. Healthy Youth Survey data were also assessed, with clusters being identified for selected risk-factors and overlaid on the obesity cluster areas. These overlays suggest a degree of concordance between risk factors and the obesity clusters identified. Obesity clusters within the Empire Health Foundation Region November 2011
Additional findings Obesity clusters within the Empire Health Foundation Region November 2011
Summaries Obesity clusters within the Empire Health Foundation Region November 2011
Discussion and sources Obesity clusters within the Empire Health Foundation Region November 2011
Obesity clusters within the Empire Health Foundation Region November 2011