Download
1 / 1
10 likes | 111 Vues
Explore results from Western Basin experiments testing distributed hydrologic models in complex mountainous areas. See improvement over lumped models and assess simulation accuracy in operational forecasting.

E N D
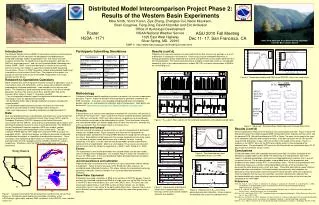
Distributed Model Intercomparison Project Phase 2: Results of the Western Basin Experiments Mike Smith, Victor Koren, Ziya Zhang, Zhengtao Cui, Naoki Mizukami, Brian Cosgrove, Feng Ding, David Kitzmiller and Eric Anderson Office of Hydrologic Development NOAA National Weather Service 1325 East West Highway Silver Spring, MD. 20910 Poster H23A - 1171 AGU 2010 Fall Meeting Dec 11- 17, San Francisco, CA North Fork American River basin looking southwest near the Iowa Hill Bridge North Fork American River basin looking southeast from the Blue Canyon Airport DMIP 2: http://www.nws.noaa.gov/oh/hrl/dmip/2/index.html Introduction The National Weather Service (NWS) of the National Oceanic and Atmospheric Administration (NOAA) continues the development and deployment of distributed hydrologic models for operational river, flash flood, and water resources forecasting. To expedite the research-to-operations pathway, the NWS has organized phases 1 and 2 of the Distributed Model Intercomparison Project (DMIP). DMIP 1 and 2 were designed as venues for the scientific community to test their models in experiments related to NWS forecasting mission goals. Phase 1 of DMIP focused on lumped and distributed modeling of simple basins in the southern Great Plains. The purpose of this poster is to provide an overview of the results of the DMIP 2 experiments in the more complex western basins. Research-to-Operations Questions DMIP 2 experiments were designed to examine research-to-operations issues in mountainous areas with complexities such as sparse data collection networks, orographically enhanced precipitation, snow, complex terrain features and others. The experiments were conducted on two basins in the Sierra Nevada Mountains: the East Fork of the Carson River and the North Fork of the American River shown in Figure 1. Questions included: - Can existing gauge networks support the application of distributed models in mountainous areas for operational forecasting? - Are distributed models able to provide improved simulations compared to lumped models? - Can distributed models generate accurate simulations of snow water equivalent and streamflow at interior locations within the basin? - How much improvement is gained by calibration of model parameters? Data Multi-year gridded estimates of precipitation and temperature were derived from gauge data compiled by the National Climatic Data Center (NCDC) and the Snowpack Telemetery (SNOTEL) program of the Natural Resources Conservation Service (NRCS). Daily and hourly precipitation observations were combined to produce hourly time series at each point location. The NWS Multi-sensor Precipitation Estimation algorithm (MPE) was used to spatially interpolate the hourly point precipitation values to 4km grids. The high resolution PRISM grids for 1971-2000 were used within MPE to account for orographic effects. Using these forcings, participants generated uncalibrated and calibrated simulations of streamflow and snow water equivalent. These simulations were compared to observations of streamflow and snow water equivalent from the U.S. Geological Survey (USGS) and SNOTEL stations, respectively. Simulations from the NWS lumped model were used as a benchmark. Participants Submitting Simulations Methodology Participants followed specific modeling instructions to address the research-to-operations questions. Figure 1 shows the locations where participants generated streamflow and SWE simulations. Instructions were provided regarding calibration and validation periods, data to use, and locations of calibration and simulation points. More details can be found at: http://www.nws.noaa.gov/oh/hrl/dmip/2/modeling_instructions.html Results A broad spectrum of statistics were computed to evaluate the simulations. We present an overview of the results here. Figure 2 presents the hourly modified correlation coefficient Rmod (McCuen and Snyder, 1975) and %Bias statistics, respectively, for the calibration and verification run periods at the calibrated basin outlets. These two figures show that many distributed models can achieve good values of these two measures, although only a few can do better than the lumped model in an overall sense. Distributed and lumped We also analyzed simulations of specific events to note the improvement of distributed models over lumped models. Figure 3 presents the measures of improvement of distributed models compared to the lumped NWS benchmark, along with the average of the values. Each plotting symbol represents the average improvement over many events. It is desirable to achieve values greater than zero in each of the plots. Looking collectively at the plots, it can be seen that distributed models provide improvements compared to the lumped model, albeit to a small degree. These results are consistent with the results from the Oklahoma experiments in DMIP 1 and 2 (Reed et al., 2004) Events The improvements from distributed models over lumped models can be more readily seen in individual event hydrographs. For example, Figure 4 shows the simulations of the Jan 24, 1996 event. In this case distributed models provided improved simulations compared to the lumped model. A priori parameters and calibration Important questions also concern the usefulness of a priori parameters and the efficacy of calibration. Figure 5 shows the values of the Rmod and %Bias measures for uncalibrated and calibrated simulations. The arrows indicate the improvement gained by parameter calibration. Nearly all models in this case benefited from parameter calibration. Snow Water Equivalent Participants generated simulations of SWE at the locations of SNOTEL gauges. Figure 6 presents the simulated and observed SWE for a large snow year for the Blue Canyon site in the NFDC1 basin and the Blue Lakes site in the CMEC1 basin. The Blue Lakes site accumulates about twice as much SWE as does the Blue Canyon site. All models accumulate snow at a rate similar to the observed for Blue Lakes. However, the onset of melt is different amongst models, and all models melt off the snow more quickly than is observed. Results (cont’d) Problems with snow accumulation are more evident for the Blue Canyon site, perhaps as a result of difficulties in tracking the rain/snow line. Other causes may be intermodel differences in treating precipitation gauge undercatch due to wind, and differences in how models determine the form of precipitation. The statistics presented here should be viewed with caution as considerable uncertainty exists in the representativeness of point SNOTEL (and other) observations of SWE to the surrounding area. Figure 6. Computed and observed SWE at two SNOTEL sites in the study basins Blue Canyon Huysink NFDC1 North Fork American River Blue Lakes Ebbet’s Pass CMEC1 East Fork Carson River Spratt Creek Poison Flats Figure 2. Rmod and % Bias statistics for the calibration period (left) and validation period (right). Figure 7. Observed – Simulated Snow Water Equivalent Centroid Date (SCD). Results (cont’d) We also computed a measure of the timing of snow accumulation and melt. Figure 7 shows the difference between the model computed SWE centroid date (SCD; Kapnick and Hall, 2010) and the observed SCD. We plot the difference in SCD in Figure 7 for each site for each of the years of the combined calibration and validation periods. Each box represents the 25-75% quartile range of SCD differences in days, while the red line is the median of the values. There is a tendency in the NFDC1 basin for the SCD to be slightly earlier in time compared to the observed value. The participants’ SCD values for the Huysink site are consistently about 10-15 days earlier than the Blue Canyon station. Conclusions Distributed models were able to provide improved streamflow simulations compared to the operational lumped model used in NWS river forecasting. The improvements were more evident in individual precipitation-runoff events and aggregated event statistics than in overall run-period statistics. The distributed models used gridded forms of the precipitation and temperature data widely used by RFCs in mountainous areas. The density of precipitation and temperature gauges was sufficient to develop gridded estimates of these variables that preserved the water balance over a multi-year span. These data were able to support effective model calibration and validation. Distributed models were generally able reproduce the behavior of snow accumulation and melt at discrete interior locations within the study basins. Initial investigation into the cause of streamflow simulation improvements indicates that distributed models may more effectively capture the temporal variation of the rain/snow line compared to the LMP model. North Fork American River Study Basins Figure 4. Simulated and observed hydrographs for Jan. 24, 1996. Nevada North Fork American River American River Carson River CMEC1 Bias % GRDN2 References Smith, M., Ding, F., Cui, Z., Koren, V., Mizukami, N., Zhang, Z., Cosgrove, B., Kitzmiller, D., and Schaake, J., 2010. Development of Gridded QPE Datasets for Mountainous Area Distributed Hydrologic Modeling. EWRI Conference, Newport, RI. Kapnick, S., and Hall, A., 2010. Observed Climate-Snowpack Relationships in California and their Implications for the Future. Journal of Climate, Vol. 23, 3446-3456. McCuen, R.H., and Snyder, W.M., 1975. A proposed index for comparing hydrographs. Water Resources Research, Vol. 11, No. 6, 1021-1024. Mizukami, N., and Smith, M., 2010. Diagnosis of inconsistencies in multi-year high space-time resolution precipitation grids over complex terrain and impacts on hydrologic modeling, J. Hydrometeorology, submitted. Reed, S., et al., 2004. Overall results of the distributed model intercomparison project. J. Hydrology, Vol 298, 27-60. a. Rmod Figure 3. Improvement of distributed models over lumped models: peak flow (top), event runoff volume (middle), and peak time (bottom). Figure 5. Improvement in Rmod and %Bias gained by parameter calibration. Arrows indicate the direction from a priori to calibrated values. b. Figure 1. Location of the North Fork American River and East Fork Carson River Basins (a). Participants generated hourly streamflow simulations at the USGS gauges (green dots) and daily SWE simulations at the SNOTEL sites (red dots). shown in b.