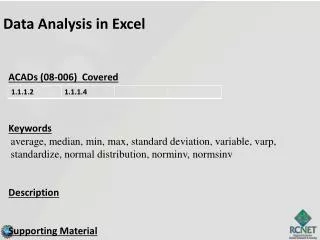
Data Analysis in Excel
In today's data-driven world, the ability to track and analyze data is vital across various sectors such as business, medicine, and sports. This guide emphasizes the significance of data analysis, illustrating its applications through examples like retail sales optimization and crime prediction by police departments. With Excel as a versatile tool, users can efficiently analyze smaller datasets through pivot tables and charts. Learn how to design data tables, implement bulletproof techniques for data integrity, and create insightful visualizations that support decision-making processes.

Data Analysis in Excel
E N D
Presentation Transcript
Importance of Data Analysis • Tracking and analyzing data are increasingly important in business, medicine, sports, politics, and many other activities • You can read a lot about this in the media; a good article is “Big Data’s Impact On the World,” (The Age of Big Data) by Steve Lohr, which appeared in the New York Times for February 11, 2012 • Also see the movie “Moneyball”
Data Driven Decision-Making • Retailers use data about sales, the economy, and the weather to tailor product selections at their stores • Shipping companies like UPS study their data to help improve delivery routes and timing • Police departments use analysis of arrest patterns, holidays, sporting events, paydays, and weather to predict where crime is likely to occur and deploy officers preventatively
Excel is Like a Swiss Army Knife • There are lots of great tools in Excel; we’ve seen a selection already • In this session we’ll look at putting them together to analyze data for a small company • If you have many thousands of lines of data, you should use a database; if you have serious statistics to do, use a specialized statistical package • But if you have a (relatively) small amount of data and want to do some simple analysis, Excel is great
Requirements • Remember the four steps? • The first thing is to think hard about what kind of analysis you might want to do and what data you need to do it • In the Real Estate example, I really could have used dates in my entries! That way I could do quarter to quarter comparisons • It’s MUCH easier to collect the data as you go along
Specification • Design the table you will need: What fields does it have? What types are they? • You can design a data collecting program similar to RealEstatePivot, with a form for user input, ranges where choices for some kinds of data are defined, etc. • We’ll be looking at pivot tables and pivot charts, but there are many other possible tools to use
Bulletproofing • Use list boxes for entries where possible • Check numeric entries to be sure they are legal; you can also include a reasonableness check • Make sure any required fields are completed • Consider an option to delete the last entry • Consider an autosave option after data is added • Have an external backup process for any important document
Using the Pivot Tools • Once you have a table, you can use it as the basis for multiple pivot tables and pivot charts to help you see your data • Our main example is done using Windows; we’ve appended some slides showing what things look like on Mac
I’ve made my data into a table, and I created a button to let me insert data at any point, not just when the spreadsheet opens. I used the name manager to name the table SalesDataTable
A new line has been inserted. The table expanded automatically to include it. After each insertion, the program saves the workbook.
My pivot table before refreshing. Claire has 6 sales and there are 24 sales in all.
I right clicked on the table and am ready to click Refresh…
Claire now has 7 sales and there are 25 all together.
Adding a Pivot Chart • When you make a chart based on a pivot table, it has the properties of the table and will refresh when the table refreshes • If you change the way data is organized in the chart, Excel will modify the pivot table accordingly, and vice-versa • The next slide shows a pivot chart (stacked column chart). You could use any chart format that makes sense
Here’s the result. You can’t see the counts because they are on the same scale as the amounts.
You can see the count is gone from the pivot table as well. You can always have more than one pivot table based on the same data table.
The Total System • This combination of tools gives us a nice way to enter and analyze our data • Basing the pivot tables and charts on the data table means that we only have to update the data in that one place, then refresh the rest • Use multiple charts to look at various aspects of your data