Download
1 / 22
220 likes | 472 Vues
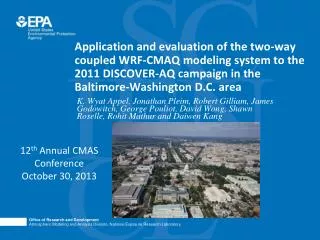
Application and evaluation of the two-way coupled WRF-CMAQ modeling system to the 2011 DISCOVER-AQ campaign in the Baltimore-Washington D.C. area. K. Wyat Appel, Jonathan Pleim, Robert Gilliam, James Godowitch, George Pouliot, David Wong, Shawn Roselle, Rohit Mathur and Daiwen Kang.

E N D
Application and evaluation of the two-way coupled WRF-CMAQ modeling system to the 2011 DISCOVER-AQ campaign in the Baltimore-Washington D.C. area K. Wyat Appel, Jonathan Pleim, Robert Gilliam, James Godowitch, George Pouliot, David Wong, Shawn Roselle, Rohit Mathur and Daiwen Kang 12th Annual CMAS Conference October 30, 2013
Reasons for High-Resolution Met/AQ Modeling • Many AQ problems have primary or near-source components • primary particulate emissions are major contributors to PM2.5 • representation of near source gradients • exposure risk depends on proximity to sources • Complex terrain, coastlines and cities require high-resolution modeling to • represent local wind fields, PBL structure, etc. • represent urban effects • Point and line source emission distributions are sub-grid at any scale • artificial dilution of primary pollutants due to instantaneous mixing of emissions into large grid-volumes • subsequent impacts on near-source chemistry and predictions of secondary pollutants
New approaches applied (in WRF) • 1. High-resolution data assimilation • Coarse grid analyses and observation data do not have sufficient resolution for high-resolution modeling • Applied an iterative processing of the WRF output to improve high-resolution surface analysis fields • 2. Improved representation of the urban environment • Use of high-resolution impervious surface and canopy fraction data • Adjust model parameters to better represent urban environments • 3. Assimilate high-resolution sea-surface temperature data • Improve representation of marine environment using a satellite derived high-resolution (1-km) sea-surface temperature dataset
1. High-Resolution Data Assimilation • Basic problem: data too sparse, especially upper air • Surface obs are more dense, including mesonets in some areas, but atmospheric nudging in PBL is not desirable • Solution: Assimilate surface and other obs data (precip, sat) into land surface parameters (e.g. soil moisture, soil temperature) • HRLDAS (Noah LSM) • Indirect soil nudging (PX LSM)
High-resolution data assimilation for soil nudging 12km Met analysis (NAM) The PX LSM uses T-2m and RH-2m analyses for indirect soil moisture and deep soil temperature nudging OBSGRID Obs Data Including mesonet WRF analysis (1km) • Initial WRF output is recycled back to OBSGRID as new background • Mesonet adds high density obs data 1km WRF/CMAQ 1km WRF WRF output (1km) WRF and CMAQ Output (1km)
Comparison of T-2m analyses for soil nudging Analysis with Iterative 1-km WRF as Background Analysis with NAM 12-km Background Without sufficient resolution data assimilation may do more harm than good
4km base 4-km w/ iterative analysis 1-km base 1-km w/ iterative analysis 1-km w/ hi-res SST (ignore) Temperature evaluation - July 1-31 RMSE • Iterative analysis reduces error mostly at night and afternoon with large bias reductions at night • Before iterative technique 1-km run was much worse than 4-km run Mean Bias
RMSE Change = RMSE (Iterative analysis run) – RMSE (base analysis run) Effects of iterative analysis for soil nudging RMSE Change RMSE Change T-2m Qv-2m Reduction in Error Reduction in Error Increase in Error Increase in Error RMSE reduced at 72% sites Bias reduced at 57% sites RMSE reduced at 78% sites Bias reduced at 65% sites
2. A Simple Bulk Urban Approach for PX LSM • Leverage very high resolution National Land Cover Database (NLCD) with multi-level urban classifications • PX LSM considers sub-grid land use fractions • Utilize NLCD-based impervious surface data directly in LSM to scale surface heat capacity • Increase surface roughness for urban land use classes to better represent developed areas • Decrease albedo in urbanized areas to account for sky-view and radiation trapping effects • Use NLCD tree canopy coverage data in energy transfer model
Urban - Base Tskin - July 28, 11am LT Tskin - July 28, 6am LT Impervious fraction 1-km WRF for DISCOVER-AQ Scaling heat capacity by impervious surface results in warmer Tskin at night but cooler Tskin in morning
Difference in Bias, July 1-15: Urban - Base T-2m Qv-2m Reduction in Error Reduction in Error Increase in Error Increase in Error T and Qv biases are smaller near urban areas in urban simulation
NAM 12-km PathFinder 4-km GHRSST 1-km High-Resolution SST Data • GHRSST • 1-km horizontal resolution global dataset • Daily (smoothed to prevent step change each day) • Tested with WRF, but not used for WRF-CMAQ yet • PathFinder SST data • 4-km horizontal resolution global dataset • 12-hourly • Used for 4-km and 1-km WRF-CMAQ simulation • NAM SST data (default) • 12-km horizontal resolution • 3-hourly • Used for 12-km WRF-CMAQ simulation The GHRSST 1-km SST does better at capturing the smaller inlets and tributaries of the Chesapeake Bay than the NAM 12-km and even the 4-km PathFinder.
Difference in T RMSEand Bias, July 1-31: GHRSST - PathFinder RMSE Change RMSE Change T-2m 63% Bias Change Reduction in Error 60% Increase in Error RMSE and bias are reduced with GHRSST compared to PathFinder and NAM12 (not shown).
Coupled two-way WRF-CMAQ v5.0.1 with direct feedback effects applied to 12-km (CONUS), 4-km and 1-km domains • NOX from lightning strikes included in 12-km simulation only • NAM SST used for 12-km simulation, PathFinder 4-km used for 4-km and 1-km simulations • Emissions based on 2010 CDC PHASE emissions with year specific updates to fires and EGU point sources (2010 mobile) • 12-km boundary conditions provided by GEOS-Chem; 4-km and 1-km boundaries provided by larger WRF-CMAQ simulations 1km 4km
Improvements in Fine-scale simulations 12 km 4 km 1 km • Representing spatial gradients • Bay breeze impacts on inland monitors O3 at 3pm LT
Hourly O3 for July 7 (1-km Domain) Hourly O3 for July 2 – 7 (1-km Domain) Improvements in Fine-scale simulations • Rapid collapse of evening PBL results in higher simulated primary pollutant concentrations • consequently lower O3 compared to observations in base model • finer resolution treatments enable better representation of evening through early-morning values
Impact of Urban Parameterization 1km Urban – Base (hourly O3) Error Difference 1km Urban – Base (hourly O3) Absolute Difference Ozone is higher in the 1-km simulation with the urban parameterization, which results in reduced error at many sites.
Improvements in Fine scale simulationsComparison with aircraft measurementsDISCOVER-AQ; July 2, 2011 Aircraft ozone measurements compare better in 1-km simulation than the 4-km and 12-km simulations.
Does finer resolution enable better representation of spatial variability? DM8HR O3 – Site 100051003 DM8HR O3 – Site 240251001 The red box plots represent the distribution of 1-km values (144 total) that reside within the same 12-km grid cell. 1-km - red 4-km - blue 12-km - green
Correlation and Variability at Fine Scales Average Diurnal Cycle of Obs/Mod Correlations (R2) Across Space for 69 AQS O3 Monitors Correlation Coefficient Hour of Day Diurnal correlation of ozone and energy spectrum (variability) are better in the 1-km and 4-km simulations than the 12-km simulation.
Conclusions • Recycling model output as background for 2nd analysis greatly improves representation of high resolution features • significantly improves overall model performance at fine-scales • Urban parameterization improves characterization of the boundary layer • results in improved model performance for O3 in the late afternoon and overnight • Use of high-resolution SST data provides a much better representation of the marine boundary layer • improves model performance of T, q, WS and WD • Improved model performance at the 4-km and 1-km model grid resolutions versus coarser 12-km grid resolution • Coupled two-way WRF-CMAQ can accurately simulate the meteorological and air quality measurements at the urban-scale • Combined analysis of surface ozone and wind fields demonstrates that the 1-km WRF-CMAQ model simulations can represent terrain, coastal, and urban effects that cannot be resolved by coarser grid model simulations
Future Work • Re-run WRF-CMAQ 12-, 4- and 1-km domains using latest inputs: • 2011 NEI • 2011 MOVES • Use 1-km GHRSST for all three domains • Model code fixes for lightning NOX and trigger 2 option • Perform intensive operational evaluation of the new results using the unique DISCOVER-AQ data available • Likely perform other simulations to test additional model improvements • Direct FDDA at fine-scales for example • Upcoming presentations on DISCOVER-AQ: • AGU Conference (hopefully present results using 2011 emissions) • 2014 AMS Conference