Managing the Software Process
Managing the Software Process. An important part of managing a software project is to ensure that the project is at all times under control. What does this mean? This means that as much as possible all risks to the project are identified and managed. But what is risk?

Managing the Software Process
E N D
Presentation Transcript
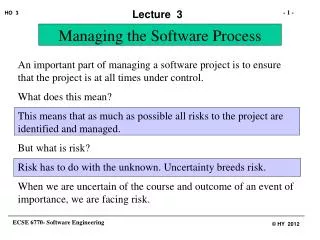
Managing the Software Process An important part of managing a software project is to ensure that the project is at all times under control. What does this mean? This means that as much as possible all risks to the project are identified and managed. But what is risk? Risk has to do with the unknown. Uncertainty breeds risk. When we are uncertain of the course and outcome of an event of importance, we are facing risk.
Risk and Risk Management Given that there are many unknowns in the SE process, the entire software engineering process may be perceived as risk management, that is: Software Engineering is reducing risk as we go forward in development. So when we find out about user needs and qualify them; when we design a product; when we test a piece of code, etc. we are managing project risk.
Risk and Risk Management We distinguish risks from other potential events by observing if: What we don’t know about the event or process yet might have a negative impact. This is called RISK IDENTIFICATION. We also need to consider: The likelihood of this event occurring with the undesirable outcome. This is RISK ANALYSIS. And The degree to which we can influence the outcome. This is RISK CONTROL.
In order to control risk, we must: Plan for its mitigation or resolution Track the progress on risk resolution Resolve the risk
Risk and Risk Management Risks can be of two general categories: Common risk; e.g. the economy would take a down turn Project specific risk; e.g. our chief architect would resign As much as we can, we need to attempt to safeguard against both types of risk. In this discussion we will primarily deal with risks to the project. Project risks can be: Business risk;e.g. customer would disagree with X Technical risk;e.g. this design would be unreliable
Risk and Risk Management A complete process of risk identification does not end when we have completed the: Identification of a particular project risk. It continues through: Definition of risk attributes or characteristics Documentation and communication of the risk
Risk and Risk Management Risk Identification: There are several techniques: Checklists Decision Analysis Examination of assumptions Project task (WBS) analysis
Risk and Risk Management • Boehm’s top 10 risks checklist (Boehm, 1991): • Personnel Shortfall • Unrealistic Schedule and budget • Developing the wrong software functions • Developing the wrong user interface • Gold plating • Excessive requirement changes • Shortfalls in externally performed tasks (e.g. sub-contractors) • Shortfalls in externally furnished components (e.g. reuse libraries) • Real-time performance shortfalls • Straining the boundaries of computer science
Risk and Risk Management Another published checklist template that has been successfully used is the Software Engineering Institute (SEI) Software Risk Taxonomy (Carr et al, 1993). This checklist organizes sources of risk into three classes each with several elements characterized by a set of attributes. The classes are: Product Engineering Development Environment, and Program (project) Constraints
Risk and Risk Management Decision Analysis: Every decision we take with respect to the project, is a potential source of risk. If there is certainty, there is no decision. If there is decision to be made, there is uncertainty. Where there is uncertainty, there is potential for risk. Decision analysis is a technique in which we identify and question every decision we have to take regarding a project as a basis for identification of potential risk.
Risk and Risk Management Examination of Assumptions: A related and similar technique to the one just described, this technique is based on the principal that if we have to make an assumption, we lack certainty. If we lack certainty, there is potential for risk. The technique requires the identification and examination of every assumption made about the project or any individual aspect of it as a basis for identification of possible risk.
Risk and Risk Management Project Task (WBS) Analysis: The Work Breakdown Structure (WBS) is the list of all activities and tasks to be performed in a project. This is a dynamic and evolving document. Early in the project, it is probably sketchy particularly in the case of later lifecycle activities and tasks for which there is at the moment limited visibility. We can use the WBS to our advantage in a number of ways to identify risks: Any activity that is not on the WBS but we feel should be is a risk source Finding yourself working on an activity that is NOT on the WBS is a risk source
Risk and Risk Management The WBS can be used as a checklist. By examining each activity on the WBS, we can identify potential risk. Activities: that are not clearly defined or definable that are not clearly decomposed or decomposable that should have concluded or have concluded but still linger are all good sources of risk.
Risk and Risk Management Definition of risk attributes or characteristics Once we have identified our potential risks, we must evaluate them and define each clearly in terms of its attributes or characteristics. The three important risk attributes or characteristics are: Probability: May be defined as a probability figure or on an ordinal scale. Consequences: If a potential risk does not have a negative consequence, it is not a risk. We can again rank the severity of the consequence of the risk on an ordinal scale. Timeframe: The amount of time we have to deal with this risk.
Risk and Risk Management Documentation and communication of the risk Once a risk is identified and its attributes determined, it is time to document it. A Risk Report Form (RRF), sometimes called a Risk Management Form (RMF) is a useful vehicle for documentation of a risk. Initially, at the identification level we can not fill out the form completely as the risk management process is not complete. We can however provide the basic information such as title or identifier of risk (name), risk probability level, consequence level (severity level), timeframe, project, WBS element to which the risk relates, time of identification, person who first identified it.
Risk and Risk Management Risk Analysis: Once our risks are identified, documented and communicated, they must be analyzed. By doing so we can prioritize risks and concentrate on the more critical ones. The activities involved are: Identify source of each risk Identify risk drivers Estimate risk exposure Prioritize and rank
Risk and Risk Management Identify Source of each risk Here we attempt to identify why a risk would appear. We need to identify the “real” reason, the root-cause. If we want to find out why? We must ask why? Ask why, wait for the answer and ask why again, several times until a sufficient root-cause is identified.
Risk and Risk Management Identify risk drivers Risk drivers are those attributes or elements (variables) that significantly impact the probability, consequence or timeframe of a risk. They are both process and product attributes or elements and may impact product quality, project cost, project time and schedule, customer relationship and a whole host of other issues. The United States Air Force (USAF, 1988) has published cost drivers for product performance and quality, Cost models such as COCOMO (Boehm, 1981), or project size models such as Function Points (Albrecht, 1979) are other sources for identification of potential risk drivers. These are however general lists. Look for specific drivers with respect to each specific risk.
Risk and Risk Management Estimate risk exposure Risk exposure is closely related to the probability of unsatisfactory outcome of an event P(u), and the value of loss sustained should this event occur L(u). In this sense the probability is a number between 0 and 1, where 0 indicates impossibility of outcome and 1 indicates certainty. L(u) is usually in terms of units of currency. Calculating risk exposure allows comparisons and ranking.
Risk and Risk Management Prioritize and rank Using figures for risk exposure and also the timeframe available to deal with the risk, we can rank order our set of project risks. This has the advantage that more critical risks would be ranked higher and probably higher priority attention. Later we will learn that as time passes and/or a risk is dealt with, the ranking may change. This further implies therefore that our Rank Ordered Risk List is a dynamic and evolving document.
Risk and Risk Management Risk Control: Plan for risk resolution: Now that we have analyzed our risks and can concentrate on the critical ones, we must move to control them. To do so however, we first have to create an action plan. We must: Identify or develop risk resolution options Compare and select best resolution approach Develop a risk resolution strategy
Risk and Risk Management Identify or develop risk resolution options There are usually more than one way to resolve a risk or a problem. Some are preferable to others. In a project context, we must identify the various ways that are open to us to deal with a particular risk. We could: Accept the risk: live with the risk and its potential consequences Avoid the risk; eliminate it altogether Mitigate the risk: Take steps to reduce the probability of it occurring Each option would have a particular consequence
Risk and Risk Management Compare and select best resolution approach Given the options selected in the previous step, we can now estimate a remaining risk exposure after each potential approach has been (theoretically) employed. Obviously, the approach which leaves the least risk exposure is the most effective approach. But is it the most efficient approach? Can we afford to take that approach. This brings the issue of cost of risk resolution into the equation.
Risk and Risk Management Now it is ALWAYS possible to reduce the risk, but this is at a cost. Facing the law of diminishing returns, we must calculate the Risk Reduction Leverage (RRL), the efficiency of risk resolution of a particular risk resolution strategy or alternatively, the point beyond which risk reduction using a given technique is not economical. Where REbeforeand REafter refer to risk exposure before and after risk reduction measure is taken. Crr is the cost of that risk resolution activity.
Risk and Risk Management Develop a risk resolution strategy Having selected the strategy to follow, we must now create a risk resolution action plan. This document shall list and describe: the resources needed, all critical times and deadlines, all indictors (actions or events that help focus our attention) all activities that must be performed, person or persons responsible.
Risk and Risk Management Risk Control: Track the progress on risk resolution and resolve the risk: Having obtained a risk action plan document, we can use it to proceed to resolve the risk and track the progress we are making towards doing so. We can do this by: Acknowledging the raising of an indicator Taking action Recording the action taken Update the plan
Risk and Risk Management • Risk Control • Of the top 10 risks according to Boehm: • Number 2 relates to time and schedule • Numbers 1,2,7 and 8 relate to resources including money • Numbers 3,4,5,9 and 10 relate to technology and the process employed • Numbers 1,2,6, 7 and 8 relate to agreements and contracts • Thus at the very least, we need to control risk from these four perspectives.
Risk and Risk Management • Therefore we need: • Time and Schedule Planning • Resource Planning • Technical Process Planning • Business Planning • We shall cover these one by one.
Time and Schedule Planning • We must ensure that we have (as much as possible) identified the activities that are to be performed and have determined their interdependencies (particularly temporal). This way we can tack and manage the project progress and make adjustments as necessary. • An artifact that provides this capability is called a project schedule. • A project schedule consists of information about interdependencies (particularly of temporal and causal nature) between: • Activities; A part of a project that takes place over some time • Milestones; The completion of a significant activity • Deliverables; Item that the someone related to the project needs
Time and Schedule Planning Identifying Activities: We start at the end! We begin with determining what they need to see at the end of the project. Working with them we come up with the list of all end_of_project deliverables. This is usually NOT just the software product but includes: User manuals, maintenance manuals, installation procedures, training manuals, to have named but a few. We then work through the process backwards to identify all the intermediate deliverables that we need to develop in order to produce these end_of_project deliverables. During this practice we take note of all the activities we need to perform to arrive at each.
Time and Schedule Planning We then identify and agree with the customer on our milestones: these are the completion of those significant activities of which the customer (and the team) need(s) to be informed during the development. It is best if the milestone is measurable. For example the completion of unit testing; assumed when at least 90% of software units have been adequately tested, according to our test plans and procedures. Many of these milestones (in fact all in a mature process) should be part of and defined in your software process (methodology). We then determine which of these milestones are deadlines. Deadlines are those milestones that must be achieved no later than a specific time. For example; first prototype by July 1, next year.
Time and Schedule Planning • We then determine the absolute duration (duration in calendar days not in person days) of each activity and the temporalinter-dependencies between all activities. These could be of several kinds: • Activities A and B must start together • Activities A and B must end together • Activity A must start before activity B starts • Activity A must start before activity B ends • Activity A must start only after activity B has ended.
Time and Schedule Planning Each activity is therefore described by the following: Name: Usually a verb phrase (e.g. Revise training manuals) Number: A numerical identifier. May be used to show hierarchy Duration: How long it is estimated to take (calendar time) Time dependencies: Pre-cursors, concurrent activities and post-cursors (as per previous page) Milestone: Is this a milestone? What is the measure? Due date: Milestone or not, when is the activity expected to be completed? Deadline: If a milestone, is there a deadline? If so what is the deadline date and time? Deliverables: What deliverables are expected –if any- at the end of this activity? Resources: What resources, including staff and technology would be needed?
Time and Schedule Planning Relating dependencies (Activity Networks): Given the information regarding each activity, we can construct a network that depicts these interdependencies. This is generically called an activity network . There networks are constructed from a number of nodes and a number of arches connecting these nodes. There are two general categories of activity networks: Those in which the activities are depicted as nodes and the arches represent transition from one activity to another Those in which the arches are the activities and the nodes represent the transitions.
Time and Schedule Planning A1 A3 Example: Activity Depends on A1 A2 A3 A1 A4 A2,A3 A5 A4 A6 A5 A7 A8 A6,A7 S A6 A5 A2 A4 E A8 A7 A1 A3 A6 A5 A4 A2 A8 A7
Time and Schedule Planning The Critical Path Method (CPM) It is possible to enhance the usefulness of an activity network by adding some of the information that we already have about each project activity to the symbol representing it. Let us start small and only add the name of the activity and its duration. We now use the following symbol to represent each node: EET stands for Earliest End Time LET stands for Latest End Time These terms and the term Slack will be defined later. Name Duration EET LET Slack
Time and Schedule Planning A CPM chart: A CPM chart uses activity duration information to calculate useful project schedule facts that can help us identify if we are on track or falling behind. We define three additional terms: Earliest End Time (EET) is the earliest time when an activity can end. It is the time the project has taken up to that point, plus the duration for that activity. Latest End Time (LET) is the latest time when an activity can end and still not make the project fall behind. Slack is the duration available for an activity during which to start without delaying the project. It is the difference between LET and EET.
Time and Schedule Planning S Example: Activity Duration Depends on A1 3 A2 5 A3 5 A1 A4 5 A2,A3 A5 10 A4 A6 5 A5 A7 10 A8 12 A6,A7 0 0 0 0 A1 A2 5 3 5 3 8 3 0 3 A4 A3 13 5 8 5 0 13 0 8 A5 A6 23 10 28 5 0 23 28 0 A7 A8 10 40 12 10 E 18 28 0 40 40 0 0 40
Time and Schedule Planning S 0 0 Critical Path: The critical path is that path through the network all of activities of which must start as soon as possible and finish on time, as any delay with any one of these activities would delay the whole project. Equivalently, the path that connect the start node to the end node and only goes through those activities with zero slack time is the critical path. 0 0 A1 A2 5 3 5 3 8 3 0 3 A4 A3 13 5 8 5 0 13 0 8 A5 A6 23 10 28 5 0 23 28 0 A7 A8 10 40 12 10 E 18 28 0 40 40 0 0 40
Time and Schedule Planning Tracking Progress: We can look at and analyze the CPM chart to identify project progress. It is however probably easier to do so by looking at the progress of each task with respect to calendar time . The Gantt chart does this for us. The Gantt chart depicts each activity against the project timeline and uses visual aids (such as color, shading or icons) to depict task duration, whether they are on the critical path, whether they have started, finished, if they have slipped or are going to do so. The information to draw a Gantt chart can, and usually does obviously come from the CPM chart and is content-wise equivalent to it.
Time and Schedule Planning 15 10 20 25 5 Today Activity A1 A2 A3 A4 A5 A6 A7 A8
Time and Schedule Planning 40 35 30 Legend: Activity A1 Duration A2 Completed A3 A4 Slack A5 Critical-completed A6 Critical-to be completed A7 A8
Resource Planning Aside from time, we also need to plan for resources related or needed in our project. Resources may be internal staff, contractors or external consultants, hardware, system software and other technology, computer time, network time, or other access types of time. Problems with the availability of any of these may spell doom for the project. If during our CPM activity we have been sufficiently vigilant to include the types and amount of resources needed to complete the activity, then resource panning in general will be easy. We shall consider the following resource types here: Staff Planning: Hardware and technology resource planning
Resource Planning • Staff Planning: • If we have kept track of who will be involved with the completion of each project activity and to what extent, then drawing up a staff schedule from the CPM graph will be a relatively easy task. In fact this task is usually automated in project management software packages. In doing so, note that: • One activity may require more than one staff member • One staff member may be working on more than one activity at a time • Non-productive or non-project time is still time
Resource Planning 15 10 Activity Duration Staff A1 3 John A2 5 John and Mary A3 5 Mike A4 5 John A5 10 John and Mary A6 5 Mary A7 10 Mike A8 12 Mary and Mike 5 Staff John A1 A2 A4 Mary A2 Mike A3 Mike on Vacation
40 30 35 25 20 Today Staff John A5 John on Vacation Mary A5 A6 A8 Mike A7 A8
Resource Planning The important issues to observe with staff planning are: Staff can be volatile. They may prove insufficiently skilled, be at the time behaviorally or psychologically unfit for the task, they may resign, retire or worse. Staff need or involvement is not uniform. For example, the number of hours a week an analyst would be working on a given project depends on the phase the project is in. This has an impact on our person-hour calculations and project/person productivity. How do we solve this problem?
Resource Planning Training Planning: Not all of your staff will be adequately trained at the time of project commencement. The last thing you want is to find out about this fact when that skill is critically needed. Training planning is essential. Training planning (and a training plan) needs to: Identify all project skill needs Identify the current baseline skill set with respect to each staff Map out a training schedule for the skill to be in place before it is needed There is sufficient back up in case of trained staff non-availability.
Resource Planning The biggest mistake made with training planning is the pseudo just-in-time approach. This is when things are arranged so that staff walk out of a training course and right into that portion of the project that requires that particular skill. Time must be allowed for skills to be absorbed, honed, and practiced a few times and mastery achieved before they are used on a real project. Whilst real just-in-time training (which incorporates the practice and mastery period) is a hallmark of a mature organization; the pseudo just-in-time approach is one of the basic signs of an extremely immature organization.
Resource Planning Hardware and technology resource planning This is more problematic that meets the eye. Firstly we need to determine the various categories of technology needed. These include: Development system computing hardware Test system computing hardware Target computing hardware Networking hardware Peripherals Host system (e.g. access to a test rocket) Project management software CASE tools Compilers and other programming tools Simulation hardware/software System software (e.g.RDBMSs or OODBMSs) Reuse libraries GUI Builders etc.