Download
1 / 15
170 likes | 406 Vues
Ocean Weather Station M - from weather forecast to climate monitoring. M/S Polarfront. Ingunn Skjelvan Bjerknes Centre for Climate Research and Geophysical Institute, University of Bergen. Non-meteorological time series. Start in 1948 61 yrs with temperature and salinity, GFI , 5 t/w

E N D
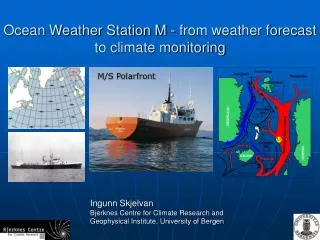
Ocean Weather Station M - from weather forecast to climate monitoring M/S Polarfront Ingunn Skjelvan Bjerknes Centre for Climate Research and Geophysical Institute, University of Bergen
Non-meteorological time series Start in 1948 61 yrs with temperature and salinity, GFI, 5 t/w 56 yrs with oxygen, GFI, weekly 28 yrs with atmospheric greenhouse gasses, NOAA, 2 t/w 18 yrs with biological parameters, IMR, weekly 8 yrs with carbonate system, BCCR, monthly 4 yrs with sea and air pCO2, BCCR, continuously 3yrs with carbon isotopes,BCCR, monthly 3yrs with direct flux/eddy correlation studies, NOC, continuously + moorings/sensors
Annual mean temperature at 2000 m depth Østerhus 2009 WARMER deep water during the last 25 yrs Geophysical Institute, University of Bergen (GFI)
The recent warming is due to different processes TEMPERATURE OXYGEN Østerhus (2009), BCCR/GFI
INCREASING annual mean wave height INCREASING atmospheric CO2 content Norwegian Meteorological Institute NOAA
atmosphere pCO2 ocean surface 2000 m time ~25 μmol kg-1 (~1.1 μmol kg-1 yr-1) DCT = +0.6 mmol kg-1 yr-1 10 m (winter values) ~9 μmol kg-1 (~0.4 μmol kg-1 yr-1) DCT = +1.3 mmol kg-1 yr-1 (~2.6 uatm yr-1) • changing deep circulation- anthropogenic origin INCREASING oceanic pCO2 DECREASING sink for atm CO2 Bjerknes Centre for Climate Research (BCCR)
-0.03 pH units over 6 years (-0.005 pH units/yr) INCREASING ocean acidification
OWSM carbon data used to verify models Coupled carbon-ecosystem model used to examine carbon and nutrient mixed layer dynamics Findlay et al., 2008
pCO2 pH Future monitoring at OWSM • Aim: continuation of the long time series • Moorings / buoys / sea gliders • Ship time for water sampling and deployment / recovery 1st application partly financed2nd application pending
Major challenges • Not enough time for overlapping measurements/calibrations
Decrease in surface-ocean pH is already measurable • Anthropogenic decline in surface pH: • 0.1 since 1750 (indirect method) • 0.02 pH units per decade since 1980 (direct method) based on Bates, Dore, Gonzàles-Dàvila et al. in Willebrand, Bindoff et al. (IPCC AR4, 2007)
Spreading of Intermediate from the Greenland Sea Greenland Sea Norwegian Sea M
Recent warming Greenland Sea Arctic Ocean Norwegian Sea Atlantic Ocean Cooling Ice cover Intermediate depth: Warming due to warmer water convected in Greenland Sea convection ~2000 M: Warming due to lack of GSDW (replaced by AODW) Below 2500 m: Warming due to geothermal driven convection and heating Heating