
Uploaded by
vivien-william
1 SLIDES
141 VUES
10LIKES
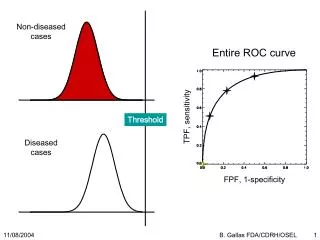
ROC Curve Analysis of Sensitivity and Specificity in Non-Diseased and Diseased Cases
DESCRIPTION
This study analyzes the Receiver Operating Characteristic (ROC) curve to evaluate the True Positive Fraction (TPF) and False Positive Fraction (FPF) in distinguishing between non-diseased and diseased cases. It highlights the relationship between sensitivity and 1-specificity for various thresholds. The findings are pertinent for clinical diagnostics, aiding in understanding the performance of health measurement tools. The analysis is based on data from Gallas at the FDA/CDRH/OSEL, emphasizing the importance of assessing diagnostic accuracy.
Download
1 / 1
Télécharger la présentation 
ROC Curve Analysis of Sensitivity and Specificity in Non-Diseased and Diseased Cases
An Image/Link below is provided (as is) to download presentation
Download Policy: Content on the Website is provided to you AS IS for your information and personal use and may not be sold / licensed / shared on other websites without getting consent from its author.
Content is provided to you AS IS for your information and personal use only.
Download presentation by click this link.
While downloading, if for some reason you are not able to download a presentation, the publisher may have deleted the file from their server.
During download, if you can't get a presentation, the file might be deleted by the publisher.
E N D
Presentation Transcript
Threshold Non-diseased cases Entire ROC curve TPF, sensitivity Diseased cases FPF, 1-specificity B. Gallas FDA/CDRH/OSEL


More Related