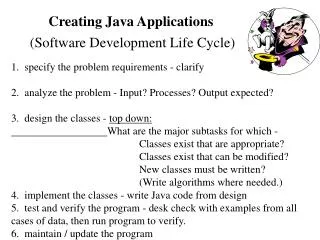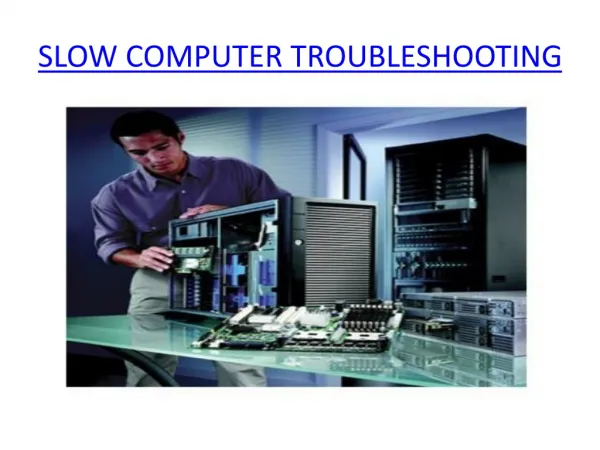
Troubleshooting Slow or Hung Java Applications
Learn tools and techniques to diagnose and resolve performance issues in your Java applications. Explore GC tuning, thread analysis, and practical case studies.


Troubleshooting Slow or Hung Java Applications
E N D
Presentation Transcript
Troubleshooting Slow or Hung Java Applications Bill Au CBS Interactive http://www.apache.org/~billa/oscon2012/
Agenda • Tools of the Trade • Case Studies
Tools – Out Of The Box • jinfo, jmap, jstack, jstat • JConsole, VisualVM • Monitor CPU usage by using JTop plug-in ($JAVA_HOME/demo/management/JTop) • java.lang.management • Platform MXBeans: runtime, operating system, class loading, compilation, garbage collection, memory, thread • Sample code in $JAVA_HOME/demo/management • JDK demo and sample was part of JDK download for jdk6u31 or older, separate download for u32+
Tools – java.lang.management • Sample code: import java.lang.management.*; ThreadMXBeantb=ManagementFactory.getThreadMXBean(); if (tb.isThreadCpuTimeSupported()) { long[] tids=tb.getAllThreadIds(); for (long tid : tids) { System.out.println(“cputime:”+tb.getThreadCpuTime(tid)); System.out.println(“usertime:”+tb.getThreadUserTime(tid)); } }
Tools • Garbage collection log • -Xloggc:<filename> • Timestamp and duration of GC events • Sizes before and after GC events • More options to explore: • -XX:+PrintGCDateStamps • -XX:+PrintGCDetails • -XX:+PrintTenuringDistribution • -XX:+PrintGCApplicationsStoppedTime • Some GC flags can be set dynamically by jinfo/JConsole/VisualVM: PrintGC, PrintGCDetails, PrintGCTimeStamps • visualgc – GUI for garbage collection monitoring
Tools • Thread dump • kill -3 (or kill –SIGHUP) • JConsole, VisualVM • ThreadMXBean • jstack (-F) • Consecutive thread dumps • Stop motion animation
Hung or Slow App • Long GC pauses and/or high GC overhead • Basic GC tuning • max heap size: -Xmx • type of collector used • -XX:+UserSerialGC • -XX:+UseParallelGC/-XX:+UseParallelOldGC • -XX:+UseConcMarkSweepGC • -XX:+UnlockExperimentalVMOptions -XX:+UseG1GC (jdk6u14+) • Advanced GC tuning • young generation size: -Xmn • Baseline, tune, measure one change at a time • Demo: HPjmeter – garbage collection analysis (and more…)
Hung or Slow App • Deadlock • Take thread dump to run the JVM’s deadlock detector • Looping Threads • Monitor CPU times of running threads • ThreadMXBean • JTop plug-in for JConsole/VisualVM • Inspect stack trace of suspicious threads
Slow or Hung App • Blocked threads • Look for blocked threads waiting on the same condition • Identify bottleneck for resource contention • Inspect code for incautious and/or improper synchronization • Demo: samurai – thread dump analysis tool • Stuck threads • Look for runnable threads with the same stack trace across consecutive thread dumps • Some common causes: • Blocking for a network call without specifying connect and/or read timeout (default may be no timeout) • Long execution time for calls to backend servers
Links • Presentation http://www.apache.org/~billa/oscon2012 • HPjmeter https://h20392.www2.hp.com/portal/swdepot/displayProductInfo.do?productNumber=HPJMETER • samurai http://yusuke.homeip.net/samurai/en/index.html https://github.com/yusuke/samurai