Download
1 / 48
480 likes | 623 Vues
Faculty of Applied Engineering and Urban Planning. Civil Engineering Department. Surveying. 2 nd Semester 2008/2009. Areas and Volumes Introduction. Areas and Volumes. Planimeters. Digital Planimeter. Optical Polar Planimeter. Planimeters.

E N D
Faculty of Applied Engineering and Urban Planning Civil Engineering Department Surveying 2nd Semester 2008/2009 Areas and Volumes Introduction
Planimeters Digital Planimeter Optical Polar Planimeter
Note : the accuracy of the results obtained from using planimeter in the measurement of areas depends mainly on the original accuracy drawn map, as well as on the experience of the operator when tracing boundary of the figure.
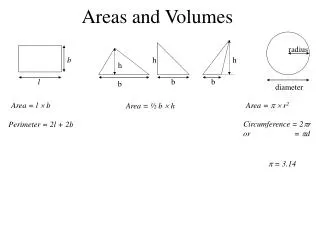
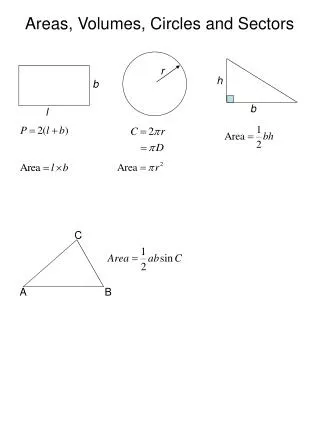
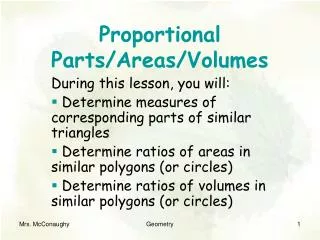
Areas • Regular Figures • Mathematical Formulae • Method of Coordinates • Irregular Figures • Graphical Method • Trapezoidal Rule • Simpson’s One-Third Rule
Mathematical Formulae 20 m 15 m
Areas by Method of Coordinates Area = 0.5(| 136840.01 – (-84890.94) |) = 110865.48 ft2
Content • Areas of Irregular Figures • Graphical Method • Trapezoidal Rule • Simspon’s One-Third Rule
Simspon’s One-Third Rule Offset Intercept ONLY used with Odd number of offsets (i.e. Even number of Intercepts)
Trapezoidal Rule Area Calculation Simspon’s One-Third Rule
Content • Volumes by: • Average-End-Area Method • Prismoidal Method • Contour Maps • Volume from Spot Levels
Mass Haul Diagram A mass haul diagram is of great value both in planning and construction. The diagram is plotted after the earthwork quantities have been computed, the ordinates showing aggregate volumes in cubic metres while the horizontal base line, plotted to the same scale as the profile, gives the points at which these volumes obtain.
Mass Haul Diagram Most materials are found to increase in volume after excavation ('bulking'), but after being re-compacted by roller or other means, soils in particular might be found to occupy less volume than originally, i.e. a 'shrinkage' has taken place when compacted in the in situ volume.