Insights on Effective Graphs: Understanding Kahneman, Knetsch, and Thaler's 2012 Findings
40 likes | 158 Vues
This analysis reviews the key lessons from Kahneman, Knetsch, and Thaler's 2012 research on good graphs in OPIM900. It outlines four critical attributes of effective data presentation: clarity, self-containment, comprehensiveness, and clutter reduction. The importance of emphasizing punch lines and the endowment effect is highlighted, showcasing how these factors influence reader interpretation. Additionally, the experiment involving randomly assigned items reveals the correlation between endowment and trade frequency, underscoring the significance of proper graph design for conveying complex data.

Insights on Effective Graphs: Understanding Kahneman, Knetsch, and Thaler's 2012 Findings
E N D
Presentation Transcript
My view of good graphs Day 1 - 2012 OPIM900 Kahneman Knetsch and Thaler Tables 3&4
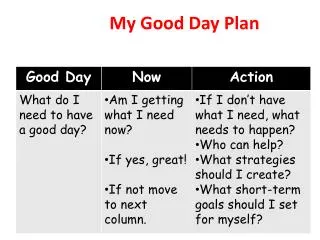
Four attributes • Punch line jumps at reader • Are self-contained • Most should be understandable without reading paper. • Contain most info a table would contain • Do not include clutter
My view of good graphs(applying to Table 3) • Punch line jumps at reader • Endowment effect is pronounced (lack of trade) • Stable over repeated rounds • Absent from tokens experiment • Are self-contained • Don’t use “V/V*” • Explain “tokens” • Describe same subjects participated in all rounds. • Additional details about experiment • Contain most info a table would contain • Add labels with values for each round • Do not include clutter • Erase horizontal lines • Ensure y-axis does not go over plausible range
Figure X. Ratio of observed/expected participants trading randomly assigned item Notes: Half of participants (N=20) were randomly endowed with an item, the other half were not. Experiment used three sets of items: tokens, mugs, and binoculars (same participants). Those with item set selling price, without buying. Based on set prices trades occur. Without endowment effect we should see about 100% of expected trades occurring. The stronger the endowment effect, the less trade.