Download
1 / 60
600 likes | 725 Vues
Causes of Reduced North Atlantic Storminess During the Last Glacial Maximum from CCSM3. Aaron Donohoe UW COGS talk April 12, 2007. Why Study North Atlantic Storms During the LGM?. d 18 O Temperature Proxy from GISP 2, Greenland Summit. 12 C. Warmer. (Stuiver and Grooves, 2000). TIME.

E N D
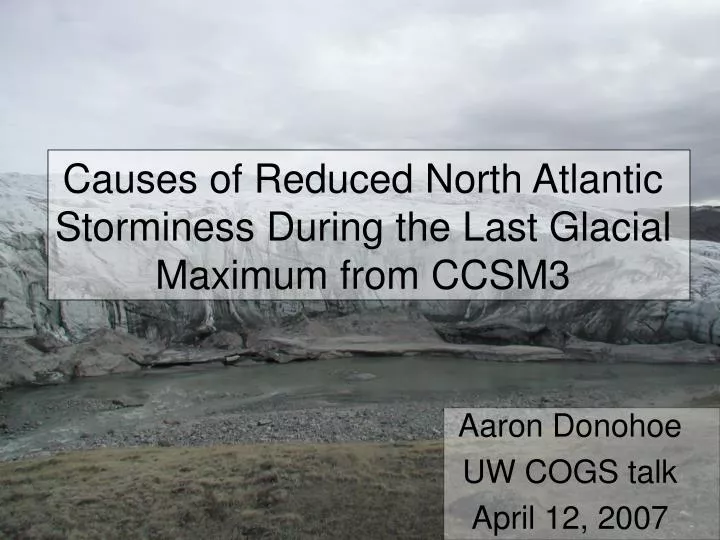
Causes of Reduced North Atlantic Storminess During the Last Glacial Maximum from CCSM3 Aaron Donohoe UW COGS talk April 12, 2007
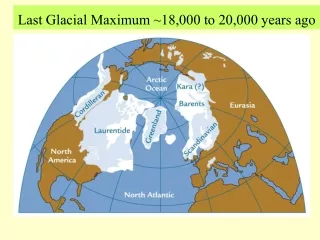
Why Study North Atlantic Storms During the LGM? d18O Temperature Proxy from GISP 2, Greenland Summit 12 C Warmer (Stuiver and Grooves, 2000) TIME (Stuiver and Grooves, 2001) The North Atlantic climate system underwent repeated instances of abrupt climate change
What do we expect the mid-latitude glacial atmosphere to be like? More Ice Stronger Equator to pole Temperature Gradient More potential energy in the midlatitudes (stronger jets and more baroclinicity) Stronger Storms First Generations of Climate Models did have stronger mid-latitude storms in the LGM
Eddy Activity in CCSM3 Baroclinicity Eddy Activity LGM – Modern Eddy Activity Modern LGM
Overview • Sensitivity of LGM storms and jets to GCM boundary conditions (review of work by Camille Li) • A closer look at North Atlantic eddy structures, statistics and energetics • A linear model of eddy growth in the North Atlantic
Section 1: When does CCSM/CAM3 give a strong LGM jet with weak eddies? Cool Colors = LGM Warm Colors = Modern Atmosphere only with ICE 4g And Climap SSTs Fully Coupled with ICE 5g Generates its own SSTs Atmosphere only with ICE 5g SSTs from coupled run Courtesy of Camille Li
Land Ice Topography Courtesy of Camille Li
The Land Ice fixes the jet • Top panel is ICE 4g runs with different SSTs/ sea ice • The Bottom panel is the same runs with ICE 5g • Ice 5g = strong jet and narrow jet Courtesy of Camille Li
Reduced Storms Require ICE 5gand appropriate SST/sea ice Present Day ICE 5G and SSTs from Coupled Run ICE 5G and Climap SSTs/Ice ICE 4G SSTs from Coupled run Neither Land Ice or SSTs/Sea Ice Alone Gives weak Storms
Summary Thus Far • CCSM 3 gives a picture of the Atlantic Circulation with a strong, narrow jet and weak eddies • The Atmosphere only component of the model reproduces a strong, narrow jet if ICE 5G Land ice is used • Weak storms are produced in the atmosphere only model only if both ICE 5G and SSTs/Sea Ice from the coupled run are used
Section II: North Atlantic Eddy Statistics • LGM statistics are a composite of 25 years of uncoupled CAM3 L26 T42 with ice 5g and Climap SSTs • Control run is a composite of 25 years of uncoupled CAM3 L26 T42 with observed SSTs from 1950 to 1975 (Ensemble Run 5 of NCAR) • Records are decomposed into eddy and mean state components with a double pass Butterworth filter with cutoff period of 10 days • Fields shown are JFM (winter)
Vertically Integrated Spatial Map of JFM Meridional Eddy Heat Transport LGM Modern K m/s LGM- Modern Contours are the jet speed at 400 hPa
Temperature Gradient Storm Heat Transport 3.0 LGM MODERN LGM MODERN 3 Vertical Average V’T’ (k*m/s) dT/dy (K/m) X 10^-6 2 1 1.5 Nov Jan Mar Nov Jan Mar Day of year Day of year Conclusion: In the modern, the storms transport more heat when the temperature gradient is largest… In the LGM, something inhibits storm growth in the middle of winter
Viewed Another Way: Baroclinicity Doesn’t Determine Eddy Heat Transport 4 LGM MODERN Vertical Average V’T’ (k*m/s) 3 2 1 1x10^-6 2x10^-6 3x10^-6 Meridional Temperature Gradient (k/m)
Jet Core Cross Sections Contours = Zonal Velocity 10 m/s intervals Colors = Temperature
Traditional Eddy Energy Cycle Plumb (1983) Mean Kinetic Eddy Kinetic Mean Potential Eddy Potential To Simplify: Neglect Sources And Energy Fluxes Decrease Eddy Kinetic by: Less Baroclinic Conv. OR more barotropic conv.
Hypothesis: LGM eddies areweaker because the strong narrow jet causes more barotropic decay • We can test this hypothesis by looking at the eddy energy budget
Eddy Energy Budget LGM 0 60 -120 -60 Conclusion: Changes in baroclinic, not barotropic Conv. account for weak LGM Eddies
In other terms: storms are bigwhen they grow baroclinically 4 LGM Modern Vertical Average V’T’ (k*m/s) 3 2 1 1 2 3 4 Baroclinic Conversion (m^2/3^3) X 10^-4
Eddy Structures: 1 point regression mapsRegression point is the black dot at 700 hPa . Colors = 850 hPa Heights (m) LGM Contours = 550 hPa Heights (m) Modern . Vertical Tilt for LGM = 50 longitude/450 hPa Modern = 70 longitude/450 hPa
Static Stability at 750 hPa Brunt-Vaisala Frequency (1/s) LGM MODERN LGM-MOD Conclusion: LGM has much larger static stability North of Jet
Summary • Eddies are suppressed from what we would ‘expect’ based on baroclinicity in the mid- winter • Eddy momentum fluxes into the narrow jet can NOT explain the suprression • Despite the enhanced baroclinicity, LGM eddies do not exhibit stronger baroclinic growth • There are differences in the vertical eddy structure between LGM and modern
Section III: Linear Stability Analysis • Simple analogy: How fast will a ball resting on top of a hill move away from it resting position when perturbed Strategy: Take mean states from the wintertime GCM WINTER climatology and access their linear stability
Perturbations (Storms) extract energy from the mean state via two different mechanisms How do Storms Grow? Meridional Temperature Gradient Velocity Shear (Baroclinic) (Barotropic) High Energy High Energy Isotherms Wind Vectors Hot Cold Low Energy Low Energy Not too hot Not too cold
1D Baroclinic Growth- Eady Growth Rate = Contours = 450 hPA Zonal Wind LGM MODERN Eady Growth Rate (1/day) LGM - MOD
Atlantic Jet 1D Barotropic Normal Modes Modern-E folds 14 days Zonal Velocity Profiles at Jet Maximum LGM - E folds 3 days
LGM Most Unstable Mode Quadrature phases: Oscillate between solutions with a period of 24 days E folds in 8 days
Modern Most Unstable Mode Stationary Mode E folds in 10 days
Stability Summary Thus Far • The Glacial is more unstable baroclinically There is a stronger temperature gradient • The Glacial is more unstable barotropically The jets are narrower • Does this mean that the glacial mean state is more unstable? Not necessarily, there are good dynamical reasons to think that a narrow jet will inhibit baroclinic growth
Explore the stability of the mean state using a linear 2 layer beta channel quasigeostrophic model Level 1- Tropopause- no vertical motion Level 2 – 450 hPa Barotropic Vorticity Equation Layers 2 and 4 ‘communicate’ Through vortex stretching Level 3- Thermodynamic Equation Level 4 – 900 hPa Barotropic Vorticity Equation Use spatial average Static Stability From GCM Level 5- Ground- no vertical motion Linearized about the DJF climatology from CCSM3
Jet Core Cross Sections Contours = Zonal Velocity 10 m/s intervals Colors = Temperature
LGM Zonally Invariant StabilityAtlantic Jet Core Cross Section Spatial Structure Contours = geopotential height Colors = height tendency Temporal Growth of Most unstable mode Ln (Storm Magnitude) Meridional Location (m) Time (seconds) Zonal Location (m) The Optimal storm structure DOUBLES IN MAGNITUDE EVERY 1.4 DAYS
Modern Zonally Invariant StabilityAtlantic Jet Core Cross Section Spatial Structure Contours = geopotential height Colors = height tendency Temporal Growth of Most unstable mode Ln (Storm Magnitude) Meridional Location (m) Time (seconds) Zonal Location (m) The Optimal storm structure DOUBLES IN MAGNITUDE EVERY 2.2 DAYS Compared to 1.4 days for the LGM, the Glacial is more unstable
Stability Summary Again • Height-Latitude cross section stability of jet core predicts Glacial storms should grow much more rapidly than the modern • Other cross section (i.e. max barotropic shear) give similar results (not shown) • Does the story change for the 3d mean state?
3D Linear Stability 1.) Define a domain over which the thermal wind between 900 hPa and 450 hPa exceeds a threshold LGM MODERN Thermal wind between 900 hPa and 450 hPa (m/s)
3D Linear Stability - cont. 2.) Smoothly transition from the jet in the domain to the zonal mean jet 3.) Make the domain periodic- damp the storm growth outside the ‘Atlantic’ LGM MODERN Zonal Velocity (m/s) Zonal Velocity (m/s) Zonal Velocity (m/s) Zonal Velocity (m/s)
Stability Summary once again • 3D mean states predict the glacial storms double in magnitude every 2.2 days versus 2.8 days for the modern • Seems like we struck out… BUT remember the static stability
LGM- LGM with Static Stability and Control Storm Growth Conclusion: Spatial Pattern of Static Stability has a profound affect on LGM storms, hardly affects the modern (not shown)
Conclusions • General Circulations Models predict a strong LGM jet with weak storms if ICE5G and appropriate SSTs/ Sea Ice are used • LGM storms are depressed in the middle of the winter because their structure doesn’t allow them to efficiently grow baroclinically • A three dimensional linear model of storm growth with the LGM spatial structure of static stability begins to explain the reduced eddy activity despite enhanced baroclinicity
Thanks To: • David Battisti • Camille Li, Jeff Yin • Gerard Roe • Joe Barsugli, Ceci Bitz • Friends, Family, Neighbors • NSF, ARCS Foundation, UW PCC, Comer Foundation, Department of Atmospheric Sciences
Thanks To: • David Battisti • Camille Li, Jeff Yin • Gerard Roe • Joe Barsugli, Ceci Bitz • Friends, Family • NSF, ARCS Foundation, UW PCC, Comer Foundation, Department of Atmospheric Sciences
How do you change Greenland temperature by 12 C in a decade ? Most likely reflects a change in heat transport Heat Transport by the Climate System The atmosphere does the lion share of the heat transport It probably makes sense to understand how it works in the Glacial
There are concurrent changes in other parts of the North Atlantic • SST at Bermuda Rise deduced from alkenones (red) • Correlates with Greenland record (blue) with one third the magnitude warmer Time (Sachs and Lehman, 1999)