Download
1 / 40
400 likes | 577 Vues
UNFCCC – NAI SOFTWARE Sector: Industrial Processes Practical Aspects and Exercises. CGE Greenhouse Gas Inventory Hands-on Training Workshop. CONTENT. Details on use of the UNFCCC – NAI Software to calculate and report GHG emissions in the Industrial Processes sector.

E N D
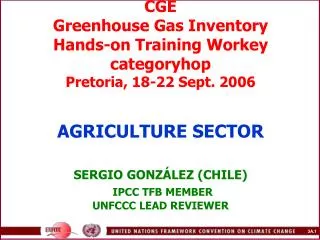
UNFCCC – NAI SOFTWARE Sector: Industrial ProcessesPractical Aspects and Exercises CGE Greenhouse Gas Inventory Hands-on Training Workshop
CONTENT • Details on use of the UNFCCC – NAI Software to calculate and report GHG emissions in the Industrial Processes sector. • Practical exercises (to be solved by the participants after the presentation).
BACKGROUND • The decision trees in the IPCC good practice guidance are used to choose a good practice method that suits national circumstances. • The UNFCCC-NAI Software contains, basically, the methods of lesser complexity that countries can use to prepare their inventories. • However, in principle, the software can be used to report the estimated emissions independently of the complexity of method used (Tier 2, 3, etc).
SECTOR: INDUSTRIAL PROCESSESExercise 2.1: Cement Production (I) Country A: Year: 2000 Data • Three Portland cement plants operate in the country. Information could not be obtained directly from the plants. The country’s national statistics report only the data included in the following table.
SECTOR: INDUSTRIAL PROCESSESExercise 2.1: Cement Production (II) Tasks Using the UNFCCC–NAI Software: • Calculate CO2 and SO2 emissions. • Verify the emissions reported in the Sectoral and Summary Tables. • Fill Table 8A (Overview Table) for the self evaluation of quality and completeness.
SECTOR: INDUSTRIAL PROCESSESExercise 2.1: Cement Production (III) Steps • Open the software and select in the Industrial Processes sector Worksheet 2-1s1B CO2 from Cement Production (Tier 2). • Enter the amount of clinker produced in the year. Estimate clinker production from cement production (because the clinker fraction is not known use the default value of 95% for Portland cement).Subtract for clinker imports and add for exports (999,970 tonne + 199,994 tonne = 1,199,964 tonne clinker produced). • Add a note in the documentation box clarifying how the quantity of clinker produced in the year was estimated.
SECTOR: INDUSTRIAL PROCESSESExercise 2.1: Cement Production (IV) Steps • Enter the CO2 EF selected. In absence of data for the clinker lime percentage consider default value of 65% and use default EF (clinker) = 0.5071 tonne CO2/tonne clinker). • Calculate CO2 emissions from clinker production. In absence of data on CKD, apply default correction factor for lost CKD (i.e. add 2% to the CO2 calculated for clinker). CKD correction factor = 1.02 • Open the software and select in the Industrial Processes sector Worksheet 2-1s2 SO2 from Cement Production (Tier 1). • Enter the amount of cement produced in the year. • Enter the SO2 default EF for cement production. • Go to the Sectoral and Summary Tables and verify the emission report.
CO2 EMISSIONS FROM CEMENT PRODUCTION (TIER 2 METHOD) ADD NOTE IN THE DOCUMENTATION BOX CLARIFYING HOW THE QUANTITY OF CLINKER PRODUCED WAS ESTIMATED
CO2 AND SO2 EMISSIONS REPORT FROM THE CEMENT PRODUCTION IN THE SECTORAL TABLE
OBSERVE THAT THE SOFTWARE CALCULATES AUTOMATICALLY THE TOTAL NATIONAL EMISSIONS CO2 AND SO2 EMISSIONS REPORT FROM CEMENT PRODUCTION IN THE SUMMARY REPORT TABLE
CO2 AND SO2 EMISIONS FROM CEMENT PRODUCTION REPORT IN THE SHORT SUMMARY TABLE
SECTOR: INDUSTRIAL PROCESSESExercise 2.2: Cement Production (I) Country A: Year: 2000 Data • Three Portland cement plants operate in the country. The production data were collected directly from the plants. The data included information on CaO content of the clinker (67% average clinker lime percentage). • Each plant exported 20% of its annual production of clinker. • All of the CaO was from a carbonate source.
SECTOR: INDUSTRIAL PROCESSESExercise 2.2: Cement Production (II) Tasks Using the UNFCCC–NAI Software: • Calculate CO2 emissions using the Tier 2 method. • Verify the emissions report in the Sectoral and Summary Tables. • Fill Table 8A (Overview Table) for the self evaluation of quality and completeness. • Print the used worksheets, the Sectoral Summary Tables and the Overview Table (8A).
SECTOR: INDUSTRIAL PROCESSESLimestone and Dolomite; Soda Ash
SECTOR: INDUSTRIAL PROCESSESProduction and Use of Mineral Products
SECTOR: INDUSTRIAL PROCESSESNitric Acid, Adipic Acid Production
SECTOR: INDUSTRIAL PROCESSESExercise 2.3: Iron and Steel Production (I) Country A: Year: 2000 Data • A plant producing iron and steel operates in the country. The data, submitted directly by the plant, included only the iron/steel production and the amount of coke used as reducing agent (80,000 tonne). It was impossible to obtain more details about the chemical composition of the reducing agent and mineral used.
SECTOR: INDUSTRIAL PROCESSESExercise 2.3: Iron and Steel Production (II) Tasks Using the UNFCCC–NAI Software: • Calculate CO2 emissions. • Verify the emissions reported in the Sectoral and Summary Tables. • Fill Table 8A (Overview Table) for the self evaluation of quality and completeness.
SECTOR: INDUSTRIAL PROCESSESExercise 2.3: Iron and Steel Production (III) Steps • Open the software and select in the Industrial Processes sector Worksheet 2-11-1 for Metal Production (because detailed data for reducing agents are not available use the Tier 1 Method. This method slightly overestimates emissions; 1–10%) • Enter the mass of reducing agent used (80,000 tonne). • Because country-specific data at the plant level are not available use the default EF for reducing agents in pig iron production (3.1 tonne CO2/tonne reducing agent).
SECTOR: INDUSTRIAL PROCESSESExercise 2.3: Iron and Steel Production (IV) Steps • Estimate CO2 emissions. • Add note in the information box explaining that it was impossible to obtain more details about the chemical composition of the reducing agent and mineral used and for this reason the correction of column C is not applied. • Go to the Sectoral and Summary Tables and verify the reported emissions estimates. • Verify that the quantity of coke used as reducing agent was subtracted from the Fuel Combustion sector. Note: Tier 2 is more accurate but also more data-intensive. Includes a correction for the carbon stored in the metals produced.
CO2 EMISSIONS FROM IRON AND STEEL PRODUCTION NOTE IN THE DOCUMENTATION BOX
CO2 EMISSIONS FROM IRON AND STEEL PRODUCTION IN THE SECTORAL REPORT TABLE
CO2 EMISSIONS FROM IRON AND STEEL PRODUCTION IN THE SUMMARY REPORT TABLE
SECTOR: INDUSTRIAL PROCESSESAluminium, Other Metals, SF6 in Foundries
SECTOR: INDUSTRIAL PROCESSESAluminium, Other Metals, SF6 in Foundries
SECTOR: INDUSTRIAL PROCESSESExercise for self evaluation 1: GHG Emissions from different industrial processes (I) Country A: Year: 2000. Data • The National Statistics Office provided production data of several industrial processes. Determine GHG emissions from those processes using the Tier 1 Method and the UNFCCC–NAI Software. • Verify the emissions reported in the Sectoral and Summary Tables.
SECTOR: INDUSTRIAL PROCESSESExercise for self evaluation 1: GHG Emissions from different industrial processes (II)
SECTOR: INDUSTRIAL PROCESSESExercise for self evaluation 1: GHG Emissions from different industrial processes (III)