Download
1 / 7
70 likes | 185 Vues
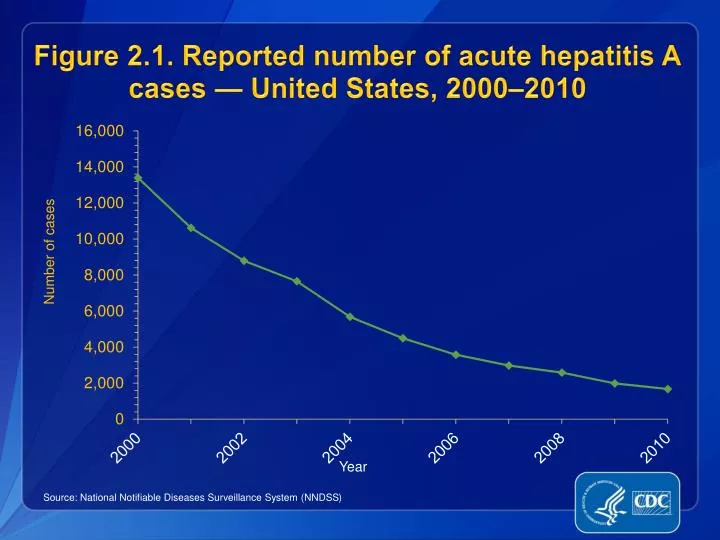
Figure 2.1. Reported number of acute hepatitis A cases — United States, 2000–2010. Source : National Notifiable Diseases Surveillance System (NNDSS ). Figure 2.2. Incidence of acute hepatitis A, by age group — United States, 2000–2010.

E N D
Figure 2.1. Reported number of acute hepatitis A cases — United States, 2000–2010 Source: National Notifiable Diseases Surveillance System (NNDSS)
Figure 2.2. Incidence of acute hepatitis A, by age group — United States, 2000–2010 Source: National Notifiable Diseases Surveillance System (NNDSS)
Figure 2.3. Incidence of acute hepatitis A, by sex — United States, 2000–2010 Source: National Notifiable Diseases Surveillance System (NNDSS)
Figure 2.4. Incidence of acute hepatitis A,by race/ethnicity — United States, 2000–2010 Source: National Notifiable Diseases Surveillance System (NNDSS)
Figure 2.5. Distribution of risk behaviors/exposures associated with acute hepatitis A — United States, 2010 * Includes case reports indicating the presence of at least one of the following risks 2–6 weeks prior to onset of acute, symptomatic hepatitis A: 1) having traveled to hepatitis A-endemic regions of Mexico, South/Central America, Africa, Asia/South Pacific, or the Middle East; 2) having sexual/household or other contact with suspected/confirmed hepatitis A patient; 3) being a child/employee in day care center/nursery/preschool or having had contact with such persons; 4) being involved in a foodborne/waterborne outbreak; 5) being a man who has sex with men; and 6) using injection drugs. Source: National Notifiable Diseases Surveillance System (NNDSS)
Figure 2.6a. Acute hepatitis A reports*,by risk exposure† — United States, 2010 Number of cases *A total of 1,670 case reports with hepatitis A were received in 2010. †More than one risk exposure may be indicated on each case report. §No risk data reported. Source: National Notifiable Diseases Surveillance System (NNDSS)
Figure 2.6b. Acute hepatitis A reports*,by risk behavior† — United States, 2010 Number of cases *A total of 1,670 case reports of hepatitis A were received in 2010. †More than one risk behavior may be indicated on each case report. §No risk data reported. ¶A total of 867 hepatitis A cases were reported among males in 2010. Source: National Notifiable Diseases Surveillance System (NNDSS)