Module 6-Foot Locker, Inc.
Module 6-Foot Locker, Inc. Taylor Blaney. Sporting Goods Stores Industry. Overview Sporting goods stores sell sporting equipment typically from outside goods manufacturers Goods in the industry range from camping equipment to basketball hoops to shoes


Module 6-Foot Locker, Inc.
E N D
Presentation Transcript
Module 6-Foot Locker, Inc. Taylor Blaney
Sporting Goods Stores Industry • Overview • Sporting goods stores sell sporting equipment typically from outside goods manufacturers • Goods in the industry range from camping equipment to basketball hoops to shoes • Annual Revenue for the sporting goods industry is over $42 billion and annual growth is steady around 2.5%-3.5% however the number of companies is slowly declining
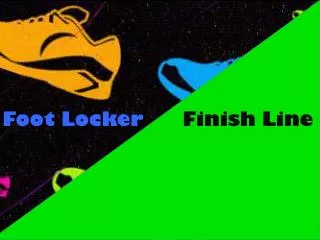
Foot Locker Overview • Global retailer of athletic shoes and apparel • Located primarily in North America, Europe, Australia, and New Zealand • Largest retailer of athletic shoes in the U.S. • Nearly $6.2 billion in sales in 2012 (73% within U.S.) • Develops few products, mostly supplied by a few top-end product manufacturers • Operate in two ways: • Athletic Stores • Direct to Customers
Foot Locker in the Industry • Market share-11.2% • No threat of acquisition • Reasons for growth • Recent consumer confidence has lead to growth in shoe sales • Exclusive contracts with suppliers • Growing Online Retail • Adolescent Demographic • Largest buyer of basketball shoes in U.S.
Estimating Cost of Capital • Equity ownership risk arises from risk of ownership and risk of needing to satisfy the obligations to debt holders • Calculate the weighted average of the rates at which the equity and debt holders are prepared to contribute after assessing the riskiness of the enterpris
Weighted Average Cost of Capital (WACC) • Calculated by multiplying after tax cost of debt capital by the portion of enterprise financed by debt holders • Add that to the product of the cost of equity capital and the portion of enterprise financed by equity holders
Capital Asset Pricing Model (CAPM) • Estimation of a company’s expected return using the risk free rate of return, beta risk, and stock specific risk • Market risk premium fluctuates around 4-8% • Beta is the sensitivity of the assets market return compared to the overall market return figured by a regression
Beta Calculation • Calculated using a regression between companies stock return and market index of returns • Stock returns is the dependent variable while market index of returns is the independent variable • Beta turns out to be 1.221 with a standard error of .245 • This gives beta values between .976 and 1.466
Other Beta Estimates • Yahoo: .91 • Google: .96 • Nasdaq: 1.25 • NYSE: 1.19 • Reuters: 1.19 • Betas are ranging from .91 to 1.19 • Calculated beta is slightly higher than industry calculated beta
Cost of Equity Capital in Foot Locker, inc. Stock • Treasury yield is 3.66% currently • Assuming a market risk premium of 5% sets expected market return at 8.66% • Use adjusted beta from Bloomberg of 1.128 • =.0366+(1.128(.0866-.0366)) • Cost of equity capital=9.30%
Cost of Debt Capital • Can be approximated using RNFL • RNFL=FEAT/avg(NFL) • Taxes are already factored in • Computes as an average RNFL of -.065%
Reasoning • Negative return on debt capital due to the fact that Foot Locker, Inc. has negative NFL • This is due to a surplus of cash assets over debt • The cash assets are earning such little returns that the interest on debt is more than the returns thus giving a negative RNFL or negative cost of debt capital
Alternative calculation • Can also calculate cost of debt capital by: • Pretax borrowing rate=interest expense/avg amount of interest bearing debt • 5/((135+133)/2)=3.371% • Must calculate the tax effect on the return by: • Pretax borrowing rate *(1-.37) • 3.371%*(1-.37)=2.35% • This amount gives us an alternate after tax cost of debt capital of 2.35%
Cost of Enterprise Capital • Must separate the amount attributed to debt and to equity • Debt is equal to NFL, for Foot Locker, inc. NFL is -$671,360,000.00 • Equity is equal to the stock price times shares outstanding, • 38.47*146,740,000=$5,645,087,800.00 • Total intrinsic value of enterprise operations is equal to $4,973,727,800.00
Cost of Enterprise Capital Cont. • Now that enterprise operation value is calculated follow this calculation: • Debt calculation: • .09% =-.065%*(-671,360,000/4,973,727,800) • Equity Calculation: • 10.56%=9.3%*(5,645,087,800.00/4,973,727,800) • Cost of enterprise capital (WACC) • .09%+10.56%=10.64%
Recalculation • To illustrate how the cash amount with low returns is hurting investors you can calculate the WACC they would receive without a negative NFL • Adjusted= WACC+(NFL/market value of equity)*(WACC-Cost of Debt Capital) • 9.3%=10.64+(-671,360,000/4,973,727,800)*(10.64--.065) • This calculation says that investors be more likely to invest without the cash that Foot Locker holds with limited returns
Updated DCF Model • Updated model using the 10.64% calculated WACC from prior
Conclusions • Enterprise value decreased due to an increase in WACC • Enterprise value of Foot Locker, Inc. is $4,973,727,800.00 • Calculated enterprise value from FCF is $6,030,000.00 • The rest of difference is due to sales growth rate difference
Value of enterprise adjusted sales growth rate • FCF model with updated WACC and 1.5% growth rate