
Regression Analysis
E N D
Presentation Transcript
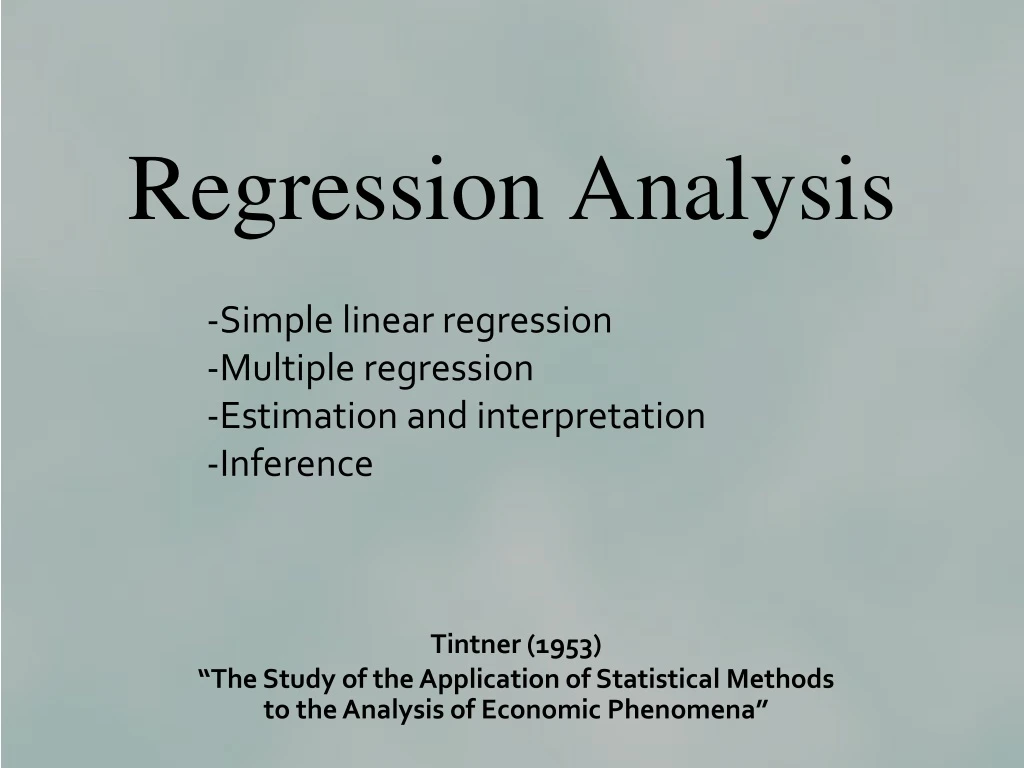
Regression Analysis Simple linear regression Multiple regression Estimation and interpretation Inference Tintner (1953) “The Study of the Application of Statistical Methods to the Analysis of Economic Phenomena”
Business analysts often need to be in position to: • - Interpret the economic or financial landscape • - Identify and assess the influence of several exogenous or predetermined factors on one or more endogenous variables • - Provide ex-ante forecasts of one or more endogenous variables • How does one achieve these objectives?
Why do Business Analysts Wish to Achieve These Objectives? • To improve decision-making! • Example: Investigate key determinants of demand for Prego spaghetti sauce: Price of Prego; price of competitors (Ragu, Classico, Hunt’s, Newman’s Own); in-store displays; coupons; price of spaghetti • Forecast sales of Prego spaghetti sauce one month, one quarter, or even one year into the future
Course of Action — Development of Formal Quantitative Models Regression Analysis
Components of Regression Analysis Regression Analysis involves four phases: • Specification – the model building activity • Estimation – fitting the model to data • Verification – testing the model • Prediction – producing ex-ante forecasts and conducting ex-post forecast evaluations
Specification Estimation Components of Regression Analysis Verification Prediction
Regression Analysis Begins with Model Specification • - Model specification entails the expression of theoretical constructs in mathematical terms • - This phase of regression analysis constitutes the model building activity • - In essence, model specification is the translation of theoretical constructs into mathematical/statistical forms • - Fundamental principles in model building: • * The principle of parsimony (other things the same, simple models generally are preferable to complex models, especially in forecasting) • * The shrinkage principle (imposing restrictions either on estimated parameters or on forecasts often improves model performance) • * The KISS principle “Keep it Sophistically Simple”
The Simple Linear Regression Model • Dependent Variable • Left-Hand Side Variable • Explained Variable • Regressand • Response Variable • Endogenous Variable • Independent Variable • Right-Hand Side Variable • Explanatory Variable • Regressor • Control Variable y = b0 + b1x + u • Coefficients β0: Intercepts β1: Slope • Error Term • Disturbance Term • Innovation
The error term u explicitly relates that the relationship between y and x is not an identity; u arises for two reasons: (1) measurement error (2) the regression inadvertently omits the effects of other variables besides x that could impact y.
Graphical Illustration y = ß0 + ß1x + u Regression line: E(y|x)= ß0 + ß1x Β1: Slope ß0 x x + h How to interpret coefficients?
Example: Estimation of Demand Relationships • Often in regression analysis, analysts have interest in estimating demand relationships, particularly for commodities. • - Analysts may wish to estimate the demand for cosmetic products, automobiles, various food products, or various beverages.
Demand Curve for Lipton Tea Average price per package QLT = B0 + B1PLT + u 5 4 3 2 1 Demand Curve Q = 2,500 – 500P P = 5 – .002Q 500 1000 1500 2000 2500 packages of Lipton tea
Demand Curve • TheDemand Curve shows the theoretical relation between price and quantity demanded, holding all other factors constant. • Axes: price is on y-axis, quantity on the x-axis • Example: Demand curve for Lipton tea, • Q=2500 – 500P • Key question: How are these numbers obtained? Interpretation:
Random Sampling • Randomly sample n observations from a population • For each observation, yi= ß0 + ß1xi + ui Qi = ß0 + ß1Pi+ ui • Goal: Estimate ß0and ß1
Translations of the Theoretical Construct into a Statistical Model • 1. Q = a-bP • 2. Q = a0 – a1P + a2I + a3A + a4PS • The coefficients a0, a1, a2, a3, and a4 are labeled the demand parameters; we expect certain signs and magnitudes of the demand parameters according to economic theory. • - Different versions of the regression model for applied analysis are possible. own-price effect (-) income effect (+) advertising effect (+) price of substitute product (+)
Population parameters Population Sampling Inference Sample parameters Sample (data) t tests, F tests, confidence intervals Regression Descriptive Statistics OLS: assumptions, properties of OLS estimates, interpretation of estimates Measure of central tendency: mean, median, mode Measures of variability or dispersion: range, variance, standard deviation, coefficient of variation
Descriptive Statistics Measures of central tendency: - mean - median - mode Measures of dispersion/variability: - range - variance -standard deviation - coefficient of variation
Critical Ingredient in all Regression Models “Sufficiently large” amount of historical data. “Ask not what you can do to the data, but rather what the data can do for you.” • Data Types: • Time-Series • Cross-Sectional
Data—The Critical Ingredient • Critical Ingredient – data (sample “sufficiently large”) • - Time-series data • * daily, weekly, monthly, quarterly, annual • DAILY – closing prices of stock prices • WEEKLY – measures of money supply • MONTHLY – housing starts • QUARTERLY – GDP figures • ANNUAL – salary figures • - Cross-Sectional Data • * Snapshot of activity at a given point in time • * Survey of household expenditure patterns • * Sales figures from a number of supermarkets at a given point in time.
Quote from Lord Kelvin “I often say that when you can measure what you are speaking about, and express it in numbers, you know something about it; but when you cannot measure it, when you cannot express it in numbers, your knowledge is of a meager and unsatisfactory kind.”
Get a Feel for the Data • Plots of key variables • Scatter plots • Descriptive statistics • mean • median • minimum • maximum • standard deviation • skewness • kurtosis • distribution
Descriptive Statistics Let X correspond to a vector of T observations for the variable X. Mean The mean, a measure of central tendency, corresponds to the average of the set of observations corresponding to a particular data series. The mean is given by: The units associated with the mean are the same as the units of xi, i= 1, 2, …, T. continued . . .
Median The median also is a measure of central tendency of a data series. The median corresponds to the 50th percentile of the data series. The units associated with the median are the same as the units of xi, i = 1, 2, …, T. To find the median, arrange the observations in increasing order. When sample values are arranged in this fashion, they often are called the 1st, 2nd, 3rd … order statistics. In general, if T is an odd number, the median is the order statistic whose number is . If T is an even number, the median corresponds to the average of the order statistics whose numbers are . continued . . .
Standard Deviation The standard deviation is a measure of the spread or dispersion of a series about the mean. The standard deviation is given by S = . The units associated with the standard deviation are the same as the units of xi. Variance The variance also is a measure of the spread or dispersion of a series about the mean. The variance is expressed as Note that . The units associated with the variance are the square of the units of xi. continued . . .
Minimum The minimum series corresponds to the smallest value, min(x1, x2, …, xT). The units associated with the minimum are the same as the units of xi. Maximum The maximum of a series corresponds to the largest value, max(x1, x2, …, xT). The units associated with the maximum are the same as the units of xi. Range The range of a series is the difference between the maximum and the minimum values. The range is expressed as Range x = max x – min x. The units associated with the range are the same as the units of xi. continued . . .
Skewness Skewness is a measure of the amounts of asymmetry in the distribution of a series. If a distribution is symmetric, skewness equals zero. If the skewness coefficient is negative (positive), then the distribution of the series has a left (right) tail. The greater the absolute value of the skewness statistic, the more asymmetrical is the distribution. The skewness coefficient is given by: The skewness statistic is a unitless measure. continued . . .
Kurtosis Kurtosis is a measure of the flatness or peakedness of the distribution of a series relative to that of a normal distribution. A normal random variable has a kurtosis of 3. A kurtosis statistic greater than 3 indicates a more peaked distribution than the normal distribution. A kurtosis statistic less than 3 indicates a more flat distribution than the normal distribution. The kurtosis coefficient is given by . The kurtosis coefficient also is a unitless measure.
Jarque-Bera test statistic (Jarque and Bera, 1980) The Jarque-Bera (JB) statistic combines the skewness and kurtosis coefficients to produce another measure of the departure of normality of a series. This measure is given by: For a normal distribution, Thus, the JB statistic is zero for normal distributions. Values greater than zero indicate the degree of departure from normality. continued . . .
Coefficient of variation The coefficient of variation is the ratio of the standard deviation to its mean. This measure typically is converted to a percentage by multiplying the ratio by 100. This statistic describes how much dispersion exists in a series relative to its mean. This measure is given by: . The utility of this information is that in most cases the mean and the standard deviation change together. As well, this statistic is not dependent on units of measurement.
Correlation Coefficient The correlation coefficient is a measure of the degree of linear association between to variables. The statistic, denoted by r, is given by: While r is a pure number without units, r always lies between -1 and +1. Positive values of r indicate a tendency of x and y to move together, that is, large values of x are associated with large values of y, and small values of x are associated with small values of y. When r is negative, large values of x are associated with small values of y, and small values of x are associated with large values of y. The closer to +1, the greater the degree of direct linear relationship between x and y. The closer to -1, the greater the degree of inverse linear relationship between x and y. Finally, when r = 0, there is no linear association between x and y.
Mode The mode corresponds to the most frequent observation in the data series x1, x2, …, xr. The units associated with the mode are the same as the units of xi. In empirical applications, often the observations are non-repetitive. Hence, this measure often is of limited usefulness.
Data Example Prices and quantities sold of Prego Spaghetti Sauce by week.
Time-Series Plot of the Volume of Prego Spaghetti Sauce Sold by Week
Descriptive Statistics and the Histogram Associated with the Volume of Prego Spaghetti Sauce
Time-Series Plot of the Price of Prego Spaghetti Sauce by Week
Descriptive Statistics of the Price of Prego Spaghetti Sauce
PPRG versus QPRG Weekly Scatter Plot of Prices and Quantities Sold of Prego Spaghetti Sauce.
Correlation Matrix The correlation between the price and quantity sold of Prego Spaghetti Sauce is -0.73.
Another Example: Relationship between Real Income and Real Consumption • Question: What is the effect of real per capita income on real per capita personal consumption expenditures? • Known information: • Dependent variable: real per capita consumption expenditures (c) • Explanatory variable: real per capita income (I) • Regression: C = ß0 + ß1I + u • Interpretation: • ß1 measures the change in real income on consumption; the marginal propensity to consume (MPC). • ß0 represents the “autonomous” level of real per capita consumption expenditures.
Random Sampling • Randomly sample n observations from a population (1980:1 to 2010:3). 123 quarterly observations. • For each observation, • Ct= 0 + 1It + ut • Goal: Estimate ß0 and ß1. Another goal: Forecasts for Ct2010:4 and beyond
Ordinary Least Squares, Regression Line, Fitted Values, Residuals y . y4 { û4 . û3 y3 } . y2 û2 { OLS: choose β0 and β1 to minimize these sum of squared prediction errors. . û1 } y1 x2 x1 x4 x3 x
Intuitive Thinking about OLS • OLS is fitting a line through the sample points such that the sum of squared prediction errors is as small as possible, hence the term least squares. • Residual û, is an estimate of the error term, u, and is the difference between sample point (actual value) and the fitted line (sample regression line). i = 1, 2, . . ., n. Actual Value Fitted Value
Minimizing Residual Sum of Squares First order conditions: Interpretation: The slope estimate is the sample covariance between x and y divided by the sample variance of x.
Assumptions Behind the Simple Linear Regression Model yi = ß0 + ß1xi + ui
Assumption 1: Zero Mean of u E(u) = 0: The average value of u, the error term, is 0.


