DATA from the MAP
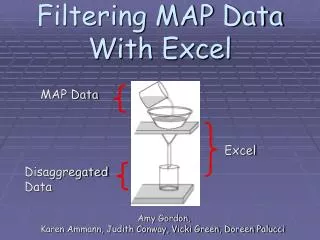
Discover how to leverage MapPoint for cost-effective GIS mapping down to street level for detailed small area statistical analysis. Create custom reports with maps, tables, and diagrams using the user-friendly interface. Learn how to transfer data between MapPoint, SQL Server, Excel, and Visual Basic for seamless reporting and analysis.

DATA from the MAP
E N D
Presentation Transcript
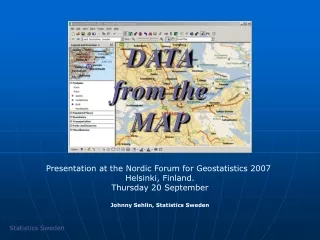
DATA from the MAP Presentation at the Nordic Forum for Geostatistics 2007 Helsinki, Finland. Thursday 20 September Johnny Sehlin, Statistics Sweden Statistics Sweden
D A T A from the MAP The problem GIS infrastructure, software and maps, is too expensive to most customers interested in small area statistics The solution Find and use cheap software's and maps. At Statistics Sweden we found MapPoint Statistics Sweden
D A T A from the MAP This is MapPoint - Maps down to street level - MS Office compatibility - Programmable in Visual basic - Price 300 Euro Statistics Sweden
D A T A from the MAP MapPoint uses Workspaces (.PTM-files) to open user defined views. In this slide show 1. Apoteket20070531.ptm Statistics Sweden
D A T A from the MAP The .PTM-file opens the map zoomed in at Stockholm and opens a grid map with population centroids for 250x250 m (urban) and 1x1 km (rural) grids Statistics Sweden
D A T A from the MAP By using the Find option in MapPoint it is easy to find the geographical area of interest. The city of Luleå up north in Sweden for instance Statistics Sweden
D A T A from the MAP In this case we are interested in the centre of Luleå and zoom in to see the street level. Statistics Sweden
D A T A from the MAP By using the drawing tools we delimit the area e.g. using the street information Statistics Sweden
D A T A from the MAP By starting the application Statistikanalys from the Tools menu MapPoint performs a point in polygon selection Statistics Sweden
D A T A from the MAP This form is shown giving some information about the selected area. By pressing the ”Skapa rapport” Button a report is genarated. Statistics Sweden
D A T A from the MAP A report like this one will be generated. The report might consist of the map, tables an diagrams and can be altered by the user Statistics Sweden
In short: MapPoint application D A T A from the MAP Draw an area on the map, choose ”Statistikanalys” in the Tools menu and select the ”Skapa rapport”Add-in Selected grids are transfered to SQL Server via a VB macro in Excel SQL Server (Database) Excel report The Database consists of statistics in tables and stored procedures run from Visual Basic macros in the Excelreport. The result is transfered to the report and is presented as a map, in tables and in diagrams. Statistics Sweden