Comparative Analysis of Microarray Data and PCA Visualization of HDAC Expression Variants
400 likes | 514 Vues
This document presents a comprehensive analysis of microarray data derived from multiple biological replicates, focusing on pre-processing steps, PCA plots, and clustering analyses of histone deacetylase (HDAC) expression levels as studied by Senese et al. It details the normalization techniques employed, the removal of outliers, and visual representations of the clusters that emerged from the analysis, including Venn diagrams and gene annotation enrichment. The findings illustrate clear separations between different HDAC treatments, contributing insights into their roles in cancer cell proliferation.

Comparative Analysis of Microarray Data and PCA Visualization of HDAC Expression Variants
E N D
Presentation Transcript
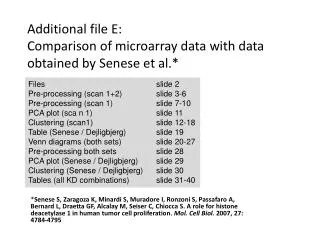
Additional file E:Comparison of microarray data with data obtained by Senese et al.* Files slide 2 Pre-processing (scan 1+2) slide 3-6 Pre-processing (scan 1) slide 7-10 PCA plot (sca n 1) slide 11 Clustering (scan1) slide 12-18 Table (Senese / Dejligbjerg) slide 19 Venn diagrams (both sets) slide 20-27 Pre-processing both sets slide 28 PCA plot (Senese / Dejligbjerg) slide 29 Clustering (Senese / Dejligbjerg) slide 30 Tables (all KD combinations) slide 31-40 *Senese S, Zaragoza K, Minardi S, Muradore I, Ronzoni S, Passafaro A, Bernard L, Draetta GF, Alcalay M, Seiser C, Chiocca S. A role for histone deacetylase 1 in human tumor cell proliferation. Mol. Cell Biol. 2007, 27: 4784-4795
Files Data description: Pool of 3 biological replicates on each array, e.g. n=1 2 slides: A and B (technical replicates) 2 scans: sc1 before amplification and sc2 after amplification(except LUC B) Slide 2
Pre-processing the data - I 1. Load the 19 arrays into dChip 2. Invariant set (first) and quantile (next)normalization 3. Model based expression (PM-MM) Slide 3
Data after normalization NB! The high “% array outlier” is due to the 2 different scan intensitiesand thus, does not reflect real outliers, just the 2 scan settings. From the P call%>40, sc1 settings alone will suffice for the analysis. Slide 4
PCA plot based on 1347 probes afterSD/m >0.4 filter: 2 Apparent outliers: A_Luc_sc2 A_HDAC3_sc2 3KD-C Remaining data look fine. Repeat analysis excluding the 2 outliers. Slide 5
Consistent clusters: HDAC1+2: all scans HDAC1: A sc1+2, B sc1 HDAC2: A sc1, B sc1+2 HDAC3: A sc1, B sc1+2 Luc: A sc1, B sc1 Out-group: HDAC1 B2, HDAC2 A2, HDAC3 A2, Luc A2 Conclusion: Treat sc1 and sc2 separately Slide 6
Pre-processing the data - II 1. Load the 10 scan1 arrays into dChip 2. Invariant set (first) and quantile (next) normalization 3. Model based expression (PM-MM) Slide 7
A_HDAC2_sc1 Before (left) and after (right) normalization toA_HDAC3_sc1 Slide 8
A_Luc_sc1 Before (left) and after (right) normalization toA_HDAC3_sc1 Slide 9
B_HDAC3_sc1 Before (left) and after (right) normalization toA_HDAC3_sc1 Mixed population? Slide 10
PCA plot based on 1100 probes afterSD/m >0.5 filter: Consistent grouping Into technical replicates for all treatments. The controls (Luc) differ the most from the rest, which is to be expected. Next: heatmaps, clustering, and sample comparison Slide 11
Unsupervised hierarchical clustering: Clear separation into 5 groups according to treatment Slide 12
Hierarchical clustering based on HDAC1 vs Luc: 249 genes Clear separation into 5 groups. All treatments are separate from LUC ctrl Gene annotation enrichement analysis when clustering genes in 'LUC_HDAC2_15f_d50.xls' C1: number of genes in a cluster or list that have this annotation term C2: number of annotated genes in this cluster or list C3: number of all genes on array that have this annotation term C4: number of all annotated genes on array P-value: binomial approximated p-value for hypergeometric distribution ***Gene Ontology*** C1 C2 C3 C4 P-value Term Name 10 186 150 15923 0.000013 anti-apoptosis 4 186 9 15923 0.000005 cadmium ion binding 6 186 84 15923 0.000509 cell surface 35 186 1570 15923 0.000148 cytoplasm 6 186 85 15923 0.000541 cytoskeleton organization and biogenesis 8 186 120 15923 0.000097 electron carrier activity 5 68 90 15923 0.000045 lipid biosynthetic process 7 11 1718 15923 0.000038 nucleotide binding 10 68 610 15923 0.000258 oxidoreductase activity 90 186 5343 15923 0.000020 protein binding 13 186 221 15923 0.000003 protein folding 6 186 86 15923 0.000575 response to stress 4 68 55 15923 0.000097 steroid biosynthetic process 5 186 28 15923 0.000023 sterol biosynthetic process 9 186 120 15923 0.000014 unfolded protein binding Slide 13
Hierarchical clustering based on HDAC2 vs Luc: 117 genes Clear separation into 5 groups. All treatments are separate from LUC ctrl ***Gene Ontology*** C1 C2 C3 C4 P-value Term Name 7 86 271 15923 0.000687 actin binding 5 86 135 15923 0.000863 cell motility 8 18 1570 15923 0.000157 cytoplasm 6 42 421 15923 0.000791 cytoskeleton 4 26 265 15923 0.000856 iron ion binding 4 42 90 15923 0.000096 lipid biosynthetic process 14 86 802 15923 0.000099 mitochondrion 20 39 4164 15923 0.000702 nucleus 8 42 610 15923 0.000170 oxidoreductase activity 46 86 5343 15923 0.000112 protein binding 4 86 28 15923 0.000018 sterol biosynthetic process Slide 14
Hierarchical clustering based on HDAC3 vs Luc: 368 genes Clear separation into 5 groups. HDAC3 is separated from LUC ctrls and HDAC12 ***Gene Ontology*** C1 C2 C3 C4 P-value Term Name 15 276 271 15923 0.000097 actin binding 13 276 150 15923 0.000003 anti-apoptosis 19 276 411 15923 0.000125 apoptosis 21 276 557 15923 0.000825 cell adhesion 24 276 477 15923 0.000004 cell cycle 6 82 208 15923 0.000745 cell division 9 276 135 15923 0.000673 cell motility 5 36 305 15923 0.000592 cell proliferation 8 276 84 15923 0.000130 cell surface 4 121 26 15923 0.000052 cholesterol biosynthetic process 5 121 84 15923 0.000489 chromatin 57 276 1570 15923 0.000000 cytoplasm 23 276 421 15923 0.000002 cytoskeleton 11 155 333 15923 0.000460 cytosol 7 121 129 15923 0.000065 DNA replication 5 18 684 15923 0.000783 endoplasmic reticulum 11 155 366 15923 0.000990 GTP binding 15 276 197 15923 0.000003 GTPase activity 7 276 81 15923 0.000603 heparin binding 6 276 46 15923 0.000174 integrin binding 4 39 121 15923 0.000222 intermediate filament 6 121 90 15923 0.000072 lipid biosynthetic process 14 121 610 15923 0.000235 oxidoreductase activity 155 276 5343 15923 0.000000 protein binding 5 35 221 15923 0.000118 protein folding 8 78 255 15923 0.000037 proteinaceous extracellular matrix 8 276 102 15923 0.000470 regulation of apoptosis 4 76 88 15923 0.000872 regulation of cell growth 17 276 272 15923 0.000007 regulation of progression through cell cycle 9 276 86 15923 0.000024 response to stress 5 121 55 15923 0.000070 steroid biosynthetic process 6 276 28 15923 0.000011 sterol biosynthetic process 7 276 86 15923 0.000852 structural constituent of cytoskeleton 17 276 358 15923 0.000208 structural molecule activity 5 155 69 15923 0.000623 translation initiation factor activity 4 35 120 15923 0.000140 unfolded protein binding Slide 15
Hierarchical clustering based on HDAC1+2 vs Luc: 117 genes Clear separation into 5 groups. All treatments are separate from LUC ctrl ***Gene Ontology*** C1 C2 C3 C4 P-value Term Name 6 67 271 15923 0.000998 actin binding 4 77 84 15923 0.000771 angiogenesis 10 156 150 15923 0.000003 anti-apoptosis 6 44 411 15923 0.000899 apoptosis 4 12 557 15923 0.000591 cell adhesion 6 156 101 15923 0.000526 chromosome organization and biogenesis (sensu Eukaryota) 4 13 421 15923 0.000288 cytoskeleton 4 10 684 15923 0.000580 endoplasmic reticulum 5 67 90 15923 0.000042 lipid biosynthetic process 4 67 88 15923 0.000542 nucleosome 6 156 103 15923 0.000582 nucleosome assembly 9 66 610 15923 0.000911 oxidoreductase activity 87 156 5343 15923 0.000000 protein binding 10 156 221 15923 0.000074 protein folding 10 156 255 15923 0.000233 proteinaceous extracellular matrix 5 89 102 15923 0.000286 regulation of apoptosis 8 89 272 15923 0.000150 regulation of progression through cell cycle 4 67 55 15923 0.000092 steroid biosynthetic process 5 156 28 15923 0.000010 sterol biosynthetic process 7 67 358 15923 0.000776 structural molecule activity 8 156 120 15923 0.000028 unfolded protein binding Slide 16
Hierarchical clustering based on HDAC123,12 vs Luc: 140 genes Clear separation into 5 groups. All treatments are separate from LUC ctrl ***Gene Ontology*** C1 C2 C3 C4 P-value Term Name 4 26 271 15923 0.000929 actin binding 12 40 1570 15923 0.000334 cytoplasm 4 16 421 15923 0.000689 cytoskeleton 5 110 90 15923 0.000432 lipid biosynthetic process 11 72 802 15923 0.000926 mitochondrion 8 38 610 15923 0.000081 oxidoreductase activity 57 110 5343 15923 0.000060 protein binding 6 72 221 15923 0.000510 protein folding 4 110 55 15923 0.000614 response to oxidative stress 4 110 55 15923 0.000614 steroid biosynthetic process 5 110 28 15923 0.000002 sterol biosynthetic process 5 110 69 15923 0.000128 translation initiation factor activity 5 72 120 15923 0.000224 unfolded protein binding Slide 17
Hierarchical clustering based on HDAC123,12 vs Luc: 440genes (common to all, AND operator) Clear separation into 5 groups. All treatments are separate from LUC ctrl ***Gene Ontology*** C1 C2 C3 C4 P-value Term Name 6 19 802 15923 0.000250 mitochondrion 4 12 610 15923 0.000832 oxidoreductase activity 14 19 5343 15923 0.000412 protein binding 4 19 221 15923 0.000122 protein folding 4 36 120 15923 0.000157 unfolded protein binding Slide 18
Comparing Dejligbjerg data to Senese data Gene analysis in dChip: Genes that are +1.5-fold up- or down-regulated and with an absolute difference of +50 (1.5f d50) are listed Slide 19
Comparing Dejligbjerg data to Senese data, gene lists from dChip: KD HDAC1 NB! These Dejligbjerg data are when comparing tountreated controls. For genes differentially expressedwhen comparing to Si controls, please see slide 30-3. Slide 20
Comparing Dejligbjerg data to Senese data, gene lists from dChip: KD HDAC2 NB! These Dejligbjerg data are when comparing tountreated controls. For genes differentially expressedwhen comparing to Si controls, please see slide 30-3. Slide 21
Comparing Dejligbjerg data to Senese data, gene lists from dChip: KD HDAC3 NB! Why does HDAC3 not appear in the Senese data? Hmm, rerun the analysis NB! These Dejligbjerg data are when comparing tountreated controls. For genes differentially expressedwhen comparing to Si controls, please see slide 30-3. Slide 22
Genes in common between all 3 knockdown experiments and 2 studies: Down-regulated genes Up-regulated genes NB! These Dejligbjerg data are when comparing tountreated controls. For genes differentially expressedwhen comparing to Si controls, please see slide 34-7. Slide 23
Comparing Dejligbjerg data to Senese data, gene lists from dChip: KD HDAC1 NB! These Dejligbjerg data are when comparing to Si controls Slide 24
Comparing Dejligbjerg data to Senesedata, gene lists from dChip: KD HDAC2 NB! These Dejligbjerg data are when comparing to Si controls Slide 25
Comparing Dejligbjeg data to Senese data, gene lists from dChip: KD HDAC3 NB! Where is HDAC3 in the Senese data? 200730_s_at protein tyrosine phosphatase type iva, member 1 NB! These Dejligbjerg data are when comparing to Si controls Slide 26
No genes in common between all 3 knockdown experiments and 2 studies: Up-regulated genes Down-regulated genes KD3 200730_s_at protein tyrosine phosphatase type iva, member 1 NB! These Dejligbjerg data are when comparing to Si controls Slide 27
Treating Dejligbjerg and Senese data together in dChip 1965 of 54613 probe sets satisfied the filtering criteria: Variation across samples: 0.85 < Standard deviation / Mean < 1000.00 P call % in the array used >= 20% Slide 28
PCA plot based on 1965 probes: Clear separation of the two data sets Clear clustering into Dejligbjerg and Senese replicates Slide 29
Unsupervised hierarchical clustering based on 814 most variable probes: Clear separation of the two data sets Clear clustering into Dejligbjerg and Senese replicates Slide 30
A closer look at the data sorted according to Dejligbjerg KD1Top 20 downregulated genes Slide 31
A closer look at the data sorted according to Dejligbjerg KD1Top 23 upregulated genes Slide 32
A closer look at the data sorted according to Dejligbjerg KD2Top 25 downregulated genes Slide 33
A closer look at the data sorted according to Dejligbjerg KD2Top 25 upregulated genes Slide 34
A closer look at the data sorted according to Dejligbjerg KD3Top 25 downregulated genes Slide 35
A closer look at the data sorted according to Dejligbjerg KD3Top 25 upregulated genes Slide 36
A closer look at the data sorted according to Senese KD1Top 25 downregulated genes Slide 37
A closer look at the data sorted according to Senese KD1Top 25 upregulated genes Slide 38
Slide 39 A closer look at the data sorted according to Senese KD3Top 25 downregulated genes NB! HDAC3 is #122 on the list; its expression in S ctrl is low (135), which probably explains, why it is not detected as significantly regulated in the group comparison analysis in dChip!
A closer look at the data sorted according to Senese KD3Top 25 upregulated genes NB! IL8, PI3, ROBO4 Slide 40