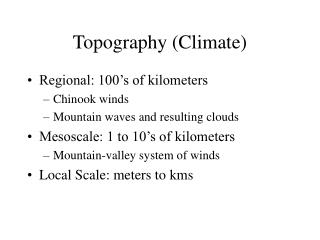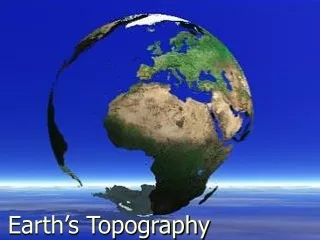
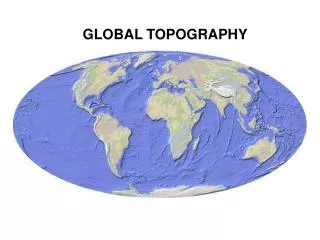
GLOBAL TOPOGRAPHY
GLOBAL TOPOGRAPHY. CONTINENTAL & OCEANIC LITHOSPHERE. CONTINENTAL & OCEANIC LITHOSPHERE. Age. Topography. mid ocean ridge. Heat Flow. mantle. . t. T T. s o. thermal Thermal boundary layer of mantle convection. t. T T. s o. +. t=0.

GLOBAL TOPOGRAPHY
E N D
Presentation Transcript
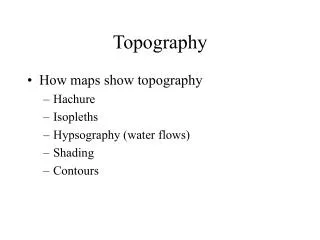
CONTINENTAL & OCEANIC LITHOSPHERE Age Topography mid ocean ridge Heat Flow mantle
t T T s o thermal Thermal boundary layer of mantle convection t T T s o + t=0 time Region of T gradient is a Thermal Boundary Layer _ t=0 z z tectothermal age of plate (ta) MOR mantle flow mantle heat loss (q)
c m t mechanical : Layer of long term strength m chemical/mechanical : Dehydrated Layer (dry=hi viscsoity) m tectothermal age of plate (ta) MOR mantle flow mantle heat loss (q) thermal Thermal boundary layer of mantle convection t (cold=hi viscosity)
Continent Oceanic Thermal Lithosphere defines convection pattern - it is the cold, overturning boundary layer. Continental Chemical Lithosphere does not participate in convective mantle overturn (inherently buoyant). Oceanic Chemical Lithosphere subducts - overturning portions of the Earth see a constant temperature boundary condition. Provides a more complex thermal coupling condition for covecting mantle below.
Cooper et al. 2004 convecting mantle failed region compression failed region extension cold hot upper crust “subducting” lithosphere viscosity = 10 Pa s lower crust 25 cratonic root warm mantle viscosity = 10 Pa s 21 bulk mantle local geotherm
Cooper et al. 2004 Chemical/Mechanical Lithosphere c Thermal Lithosphere t Dynamic Mantle Sub-Layer
surface heat flow mantle heat flow c t 0 Upper Crust Lower Crust 50 100 Depth (km) 150 Chemical Lithosphere 200 Average Thermal Lithosphere 250 300 0 200 400 600 800 1000 1200 1400 Temperature (Celsius)
700 4.5 4 600 3.5 500 3 Radiogenically Depleted Root Temperature Drop Across Sub-Layer (C) 400 Thermal/Chemical BL Thickness Ratio 2.5 Radiogenically Enriched Root 300 2 200 1.5 100 1 40 60 80 100 120 140 160 180 200 Chemical Boundary Layer Thickness (km)
Preserving & Destroying Cratonic Lithosphere The Structure of 4 0 3 100 Chem Thermal/Chemical Ratio Therm depth (km) 200 2 55 50 300 60 45 40 50 100 150 200 65 Latitude 35 400 Chemical Lithosphere (km) Yuan & Romanowicz 2010
CRATON INSTABILITY CRATON STABILITY Preserving & Destroying Cratonic Lithosphere UNDERSTAND STABILITY TO UNDERSTAND INSTABILITY
chemically real light material - crust (has own rheology) chemically light material - root (own rheology) mantle failed regions cold hot base of thermal lithosphere continental lithosphere is cool & more viscous than bulk mantle 21 hot viscosity 10 Pa s 26 cold viscosity 10 Pa s MODELING CRATON STABILITY
MODELING CRATON STABILITY MODELING CRATON STABILITY Send Continent into Model Subduction Zone See What it Takes to Save Root & Keep Crust Stable 300+ Simulations Later …
MODELING CRATON STABILITY - BUOYANCY Buoyancy Does Not Lead To Stability (even w/ temperature dependent viscosity) 7 Myr 29 Myr
MODELING CRATON STABILITY - VISCOSITY Root 1000X Viscosity of Mantle at = Temp Viscosity Does Not Lead To Stability 50 Myr Viscosity+ Critical Thickness Can Lead To Stability 100 Myr
1.0 Root/Mantle Viscosity Ratio = 1000 Extreme De-Hydration 0.8 Normalized Root Extent 0.6 0.4 50 Myr 100 Myr 150 Myr 0.2 120 140 160 180 200 250 Root Thickness (km) Lower Ratio (>100) Can Not Prevent Viscous Root Deformation MODELING CRATON STABILITY - VISCOSITY
MODELING CRATON STABILITY - VISCOSITY Root 1000X Viscosity of Mantle at = Temp Viscosity Does Not Lead To Stability 50 Myr Viscosity+High Craton Yield Stress Can Lead To Stability 100 Myr
MODELING CRATON STABILITY - YIELD STRESS 1.0 1.5 2.0 2.5 3.0 3.5 4.0 Craton Does Not Fail Under Stress Due to High Yield Strength Buffer Cratons from High Stress and They Will Not Yield
Auto makers consider it impractical to make drivers heads stronger so ……...
MODELING CRATON STABILITY - MOBILE BELTS Mobile Belts Can Provide Craton Stability (act as crumple zones to buffer stress) 50 Myr 100 Myr
REGENERATING MOBILE BELTS (Crumple Zones) if subduction starts offshore, forms island arc, then migrates on shore - craton will be buffered if subduction starts at time B - craton will be stressed Dietz [1963]
craton yield ratio = 0.5 craton no crumple zone yield ratio = 1.0 crumple zone model mobile belt (deep green) yield stress relative to craton (pale green) yield = 0.5
IN STABILITY Dry Viscosity/Thickness Rehydrate/Thin from Below High Yield Stress Rehydrate Mobile Belt Stress Buffers Lack of Buffer
Loss of > 120 km of Archaean lithosphere, Sino-Korean craton Precambrian Palaeozoic Mesozoic Cenozoic Silurian volcanism Basin development/volcanism Volcanism and extension barren kimberlite diamond kimberlite Archean crust (3800 Ma) Asthenosphere (1300 C) Asthenosphere (1300 C) S-K C crust Asthenosphere (1300 C) Asthenosphere (1300 C) removed cratonic root cratonic root
Low Angle Subduction Would Allow For Rehydration Weakening S-K C Why Geologically Recent Instability ? Weakening Elements in Place in Past
IN STABILITY Increasing Mantle Stress
Failure Zone Subducting Slab Horizontal Surface Velocity Track Temperature, Strain Rate, and Stress Profiles To Get Average Lithospheric Stress Gives a Measure of Convective Mantle Stress Vary Internal Heating To See How Mantle Stress Varies With Convective Vigor
Lower Viscosity Dominates Stress Scaling INCREASE INTERNAL HEATING DECREASE MANTLE VISCOSITY 375 250 Lithospheric Stress (Mpa) 125 0 6 7 7 5x10 1x10 2x10 Internal Heating Rayleigh Number
MODELING CRATON STABILITY MODELING CRATON STABILITY O’Neill et al., Lithos (2010) Vary Cratonic Properties: Viscosity, Yield Stress, Buoyancy Vary Mantle Properties: Clayperon Slope, Upper/Lower Mantle Viscosity, Convective Vigor (increases in past)
Dehydrated Craton Stress (Mpa) Mantle Heat Production Weakened (Hydrated) Craton Weakened (Hydrated) Craton Small Disruption, No Recycling Large Disruption, Recycling
Reference (dry) Weakened (rehydrated) Mantle Stress (Mpa) Craton Yield Stress (Mpa) Past Present Future Geologic Time
High Craton Viscosity Leads to Stability in Thick Root Limit. INSTABILITY: Rehydrate to Lower Viscosity High Yield Stress Relative to Ocean & Peripheral Continental Lithosphere Leads to Stability INSTABILITY: Lower Yield Stress (water) or No Peripheral Buffer Mantle Stress Can Increase Over Time Due To Increasing Mantle Viscosity Greater Potential for INSTABILITY in Geologic Present Vs. Ancient Past