Download

1 / 17
170 likes | 336 Vues
On the Efficiency of Image Metrics for Evaluating the Visual Quality of 3D Models. Guillaume Lavoué. Mohamed Chaker Larabi. Libor Vasa. Université de Lyon LIRIS. Université de poitier XLIM-SIC. University of West Bohemia. An illustration. Smoothing Taubin , 2000. Watermarking

E N D
On the Efficiency of Image Metrics forEvaluating the Visual Quality of 3D Models GuillaumeLavoué Mohamed ChakerLarabi LiborVasa Université de Lyon LIRIS Université de poitier XLIM-SIC University of West Bohemia
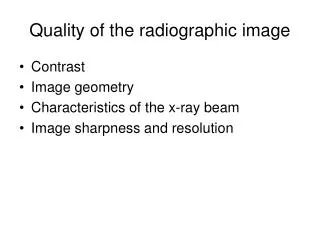
An illustration Smoothing Taubin, 2000 Watermarking Wang et al. 2011 Original 0.14 0.40 Simplification Lindstrom, Turk 2000 Watermarking Cho et al. 2006 Noise addition 0.51 0.62 0.84 Same Max RootMean Square Error (1.05 × 10⁻³)
Qualitymetrics for staticmeshes MSDM [Lavoué et al. 2006] MSDM2 [Lavoué 2011] [Torkhani et al. 2012] Local curvaturestatistics Distorted model Local differences of statistics Matching Local Distortion Map Spatial pooling Original model Global Distortion Score
Our previousworks Distortion score Why not using Image QualityMetrics? Such image-basedapproach has been alreadyused for driving simplification [Lindstrom, Turk, 2000][Qu, Meyer, 2008]
Our study • Determine the best set of parameters to use for such image-based quality assessment approach. • Compare this approach to the most performing model-based metrics.
Manyparameters • Which 2D metric to use? • How manyviews, whichviews? • How to combine the 2D scores? • Whichrendering, lighting? • In ourstudy, weconsider: • 6 image metrics • 2 rendering algorithms • 9 lighting conditions • 5 ways of combining image metric results • 4 databases to evaluate the results Around 100,000 images
Image QualityMetrics • Simple PSNR and Root Mean Square Error • MSSIM (multi-scaleSSIM) [Wang et al. 2003] • VIF (visual information fidelity) [Sheikh and Bovik, 2006] • IWSSIM (information content weightedSSIM) [Wang and LI, 2011] • FSIM (feature similarity index) [Zhang et al. 2011] State of the art algorithms
Generation of 2D views andlightning conditions 42 cameras placed uniformly around the object Rendering using a single white directional light source The light iseither fixed with respect to the camera, or with respect to the object 3 positions: front, top, top-right • So we have 3*2 = 6 lighting conditions • Wealsoconsideraverages of object-light, camera-light and global 9 conditions
Image Rendering Protocols • Weconsider 2 ways of computing the normals, with or withoutaveraging on the neighborhood.
Pooling algorithms • How to combine the per-image quality score into a single one? • Minkowski normispopular: • Wealsoconsider image importance weights [Secord et al. 2011] Perceptual model of viewpointpreference Surface visibility
The MOS databases • The LIRIS/EPFL General-PurposeDatabase • 88 models (from 40K to 50K vertices) from 4 referenceobjects. • Non uniform noise addition and smoothing. • The LIRIS MaskingDatabase • 26 models (from 9K to 40K vertices) from 4 referenceobjects. • Noise addition on smooth or rough regions. • The IEETA Simplification Database • 30 models (from 2K to 25K vertices) from 5 referenceobjects. • Three simplification algorithms. • The UWB Compression database • 68 modelsfrom 5 referenceobjects • Differentkinds of artefacts from compression
Results and analysis • Basicallywe have a full factorial experiments heavily used in statistics to study the effect of different factors on a response variable • We consider 4 factors: • The metric (6 possible values) • The lighting (9 possible values) • The pooling (5 possible values) • The rendering (2 possible values). • 540 possible combinations • Weconsidertworesponse variables: • Spermancorrelation over all the objects • Spermancorrelationaveraged per objects
Results and analysis For a given factor associated with npossible values, we have n sets of paired spearman coefficients. To estimate the effect of a given factor on the objective metric performance, we conduct pairwise comparisons of each of its value between the others (i.e. n(n-1)/2 comparisons). We have paired values, sowecan do betterthan a simple comparison of the means. Statistical significance test (not Student but Wilcoxon signed rank test). Westudy the median of paired differences, as well as the 25th and 75th percentiles.
Influence of the metrics • IWSSIM provides the best results • FSIM and MSSIM are 2nd best, significantlkybetterthan MSE and PSNR. • VIF provides instable results (see the percentiles).
Influence of the lighting • Indirect illuminations providebetterresults • Light has to belinked to the camera • Object-front is not sobad, but not its performances are not stable.
Influence of the pooling • Low values of P are better. • Weights do not bringsignificantimprovments.
Comparisonswith 3D metrics For easy scenarios: 2D metrics are excellent Howeverwhen the taskbecomes more difficult, 3D metrics are better But, still, simple image-basedmetrics are betterthan simple geometricones.