New AYP Definitions & Calculations for School Performance Evaluation
260 likes | 338 Vues
Detailed guide on calculating AYP results for the 2006-2007 school year, including participation, performance, and new index scoring system. Learn how to assess school achievement effectively.

New AYP Definitions & Calculations for School Performance Evaluation
E N D
Presentation Transcript
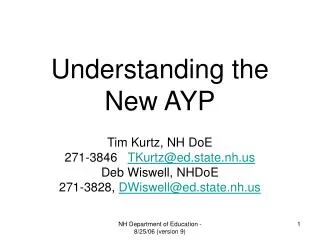
Understanding the New AYP Tim Kurtz, NH DoE 271-3846 TKurtz@ed.state.nh.us Deb Wiswell, NHDoE 271-3828, DWiswell@ed.state.nh.us NH Department of Education - 8/25/06 (version 9)
2006 AYP Results(impacts school year 2006-2007) NH Department of Education - 8/25/06 (version 9)
Basic AYP Decisions • Calculate “Other Indicator” for the school • Calculate Participation rate for the school and each subgroup • Calculate Performance for the school and each subgroup • Calculate performance • If not OK, then check confidence interval • If still not OK, then check safe harbor NH Department of Education - 8/25/06 (version 9)
Old/New AYP Comparison NH Department of Education - 8/25/06 (version 9)
Old/New AYP Comparison NH Department of Education - 8/25/06 (version 9)
Grades 3-8 NECAPAchievement Levels NECAP Cut points • Commissioners from VT, RI, and NH adopted cut points on January 20 • Proficiency at the student level includes performance at achievement levels 3 and 4. Achievement Levels: • Level 1: Substantially Below Proficient • Level 2: Partially Proficient • Level 3: Proficient • Level 4: Proficient with Distinction Scaled Scores will be reported as a 3-digit number where the first digit is the grade level and the other part will be a score 00 to 80 (reported as whole numbers at the student level). X40 is the reported cut point for Proficient. Grade 3: 300-380 Grade 4: 400-480 Grade 5: 500-580 Grade 6: 600-680 Grade 7: 700-780 Grade 8: 800-880 NH Department of Education - 8/25/06 (version 9)
New AYP Definition – some details An External AYP Task Force met to make recommendations to the Department. After review by the Internal AYP Task Force, we have arrived at the following decisions: • Racial categories (no change) • Defined by BOY (Beginning of Year) submissions • Other Indicator (no change) • Attendance Rate (90% or improvement over previous year) • Calculated from EOY submissions • Participation assigned to testing school • Performance assigned to teaching school • Full Academic Year (FAY) for performance calculations • In the future, October 1 of teaching year • 310 half days of enrollment is the proxy this year NH Department of Education - 8/25/06 (version 9)
New AYP Definition: Minimum n(minimum number of students in group required in order to perform calculation) • 95% Participation rate: 40 for each group within testing grades in school or district • 75% Graduation rate: 40 within school or district • 90% Attendance rate: 40 within school or district • Includes all grades 1-8 in the school or district • Performance targets:11 for each group within testing grades in school or district NH Department of Education - 8/25/06 (version 9)
New AYP Def: Index System Modified Index System provides partial credit for scores below Proficient. A school’s index score will be the average of all student index points assigned to the school. NH Department of Education - 8/25/06 (version 9)
Scaled Scores for each IndexNECAP NH Department of Education - 8/25/06 (version 9)
Raw Score to Performance IndexConversion table for NH-Alt * The lowest score any scoreable portfolio can earn is 13 raw score points. ** A raw score of 0 is only possible if the portfolio submitted was judged to be unscoreable by two trained and independent scorers. NH Department of Education - 8/25/06 (version 9)
New AYP Def: Starting Points Starting Points: For each content area separately, create a new baseline via the 20% method outlined in NCLB • Determine index for each school • Rank schools by each index • Identify at “20th percentile” school “20th percentile” school: the school where 20% of the students in the whole list attend that school or a school with a lower index. • That school’s index is the starting point Starting points: Reading 82, Mathematics 76 NH Department of Education - 8/25/06 (version 9)
New AYP Def: AMOs Annual Measurable Objectives 2 year intervals, equally spaced to 100 NH Department of Education - 8/25/06 (version 9)
An Index Example: Two schools Two schools, both with 180 students tested and 61.1% of their students scoring proficient or better in reading. NH Department of Education - 8/25/06 (version 9)
New AYP Def: Confidence Intervals For each subject separately: • Calculate the within-school variance for each school. • Calculate the average within-school variance for the state. • Calculate the standard error for each group • Calculate the 99% confidence interval for each group For NH Reading: 603.38615 Math: 800.72625 The smallest index allowed with the CI is: AMO – CIgroup Where: indexstudent= index score for the student mean_indexschool = average index score for the school to which the student belongs nindexstudent= the number of student index scores for the school of interest nschools = the number of schools, and ngroup = number of students in the group NH Department of Education - 8/25/06 (version 9)
The general question is: What score on NECAP corresponds to 240 on NHEIAP? Percent of students in Grade 3 & 6 combined score Basic or above in Reading on May 2004 NHEIAP = 73.3% (Math: 77.9%) 200 240 300 X00 X?? X80 Answer: 73.3% of students in Grades 3-8 combined score at or above X37 in Reading and X34 in Mathematics on Oct. 2005 NECAP New AYP Def: Safe Harbor “Equi-percentile” comparison NH Department of Education - 8/25/06 (version 9)
Safe Harbor – an example For reading, the percent of students scoring below 240 on the May 2004 NHEIAP will be compared to the percent of students scoring below X37 on the October 2005 NECAP. NH Department of Education - 8/25/06 (version 9)
Special Note on Data • Reports based on student demographic and program participation data reported by districts • EOY (End of Year) files • BOY (Beginning of Year) files • SPEDIS, ESL, F&R systems • Known Issues • SPEDIS /SASID Match • FAY (Full Academic Year) – see next page • Review AYP Reports carefully • Check FAY • Check Educational Disability NH Department of Education - 8/25/06 (version 9)
Schools with Known FAY issuesReports for these schools and for their districts are based on assuming all student included these schools’ EOY files were enrolled for a full academic year. In fact, not all students in these schools were enrolled for a full academic year. Woodsville Elementary School Memorial Middle School Hanover Street School Lebanon Junior High School Mt. Lebanon School Sacred Heart Public School School Street School Seminary Hill School McDonough School New Boston Central School Iber Holmes Gove Middle School Lamprey River Elementary School A. Crosby Kennett Middle School Epping Middle School Henry Wilson Memorial School Edward Fenn School Carpenter Elementary School Crescent Lake School Effingham Elementary School Kingswood Regional Middle School New Durham Elementary School Ossipee Central School Haverhill Cooperative Middle School NH Department of Education - 8/25/06 (version 9)
AYP Results and Resources • www.ed.state.nh.us • AYP Reports at grades 3-8 • AYP Data Explained • AYP Look-up Table Explained • AYP Lookup Table (pdf and Excel formats) • Csv file of all results • Understanding the New AYP (ppt) • Separate HS District Reports (old AYP def) NH Department of Education - 8/25/06 (version 9)
AYP – Work for Next year • Growth: • Measures of Growth at the student level to provide support for the Commissioner’s Follow the Child initiative • NH DoE submitted a letter of interest to USED February 17 • Taskforce met on February 22, March 28, April 18, May 9, Aug. 22 • NH DoE intends to submit a proposal to USED by November 1, 2006 • Out of District Students in Private Placements • How to include students placed in out-of-district private placements? • Writing and Science • Neither Writing nor Science is scheduled to be a part of AYP at this time NH Department of Education - 8/25/06 (version 9)