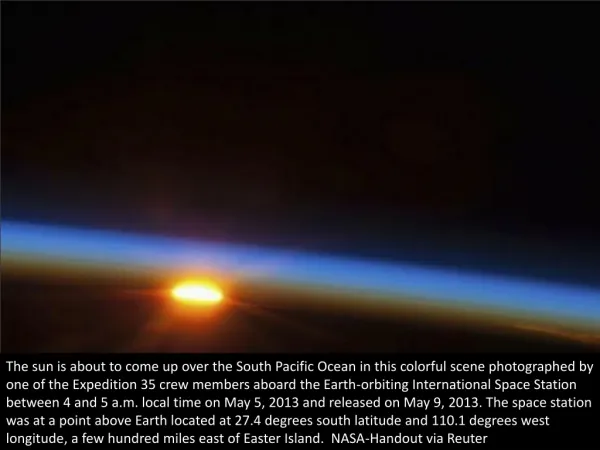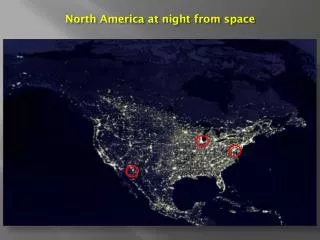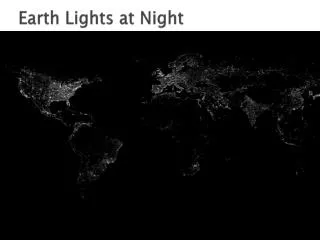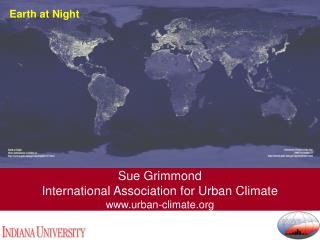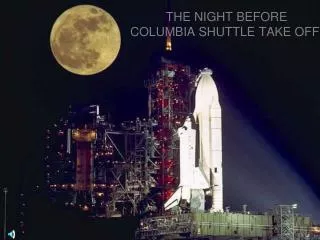
Earth at Night from Shuttle
660 likes | 839 Vues
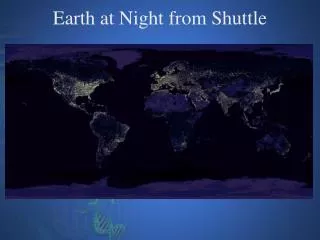
Earth at Night from Shuttle. 1200—400 million people 1300—400 million people 1400—350 million people 1500—450 million people 1600—550 million people 1700—600 million people 1800—900 million people 1900—1.5 billion people 2000—6.0 billion people 2010—7+ billion people. Exponential

Earth at Night from Shuttle
E N D
Presentation Transcript
1200—400 million people • 1300—400 million people • 1400—350 million people • 1500—450 million people • 1600—550 million people • 1700—600 million people • 1800—900 million people • 1900—1.5 billion people • 2000—6.0 billion people • 2010—7+ billion people
Exponential growth Lag phase
Exponential growth J-Curve
Linear Growth 2 4 6 8 10 etc. 2 etc. 2 2 2
#’s Time
Exponential Growth 2 4 8 16 32 etc. 16 etc. 8 4 2
#’s Time
Carrying Capacity • “Niche spaces” • Limiting Factors
Limiting factors • Density dependent • Density independent
Density dependent factors • Habitat • Food • Water • Shelter • Etc • Disease • Behavior
Density independent factors • Climate (?) • Geology • Geography • Etc
# live births BR = x 1000 Mid-year population
# Deaths DR = x 1000 myp
BR - DR APGR = 10
20 - 8 APGR = = 1.2 % 10
100 10 110 11 121 12 133 Etc
#’s Time
70 DT = APGR
70 DT = = 58.33 years 1.2 % 1954 = 2.7 billion; Current = <7 billion
Net Migration = # Immigrants - # Emigrants x 1000 myp
Adjusted Growth Rate = Net migration + APGR 10
70 Adjusted DT = Adjusted GR
#Births = 40,000 #Deaths = 20,000 Mid-year population = 2,000,000 Immigrants = 12,000 Emigrants = 2,000
40,000 BR = x 1000 2,000,000
40,000,000 BR = = 20 2,000,000
20,000 DR = x 1000 2,000,000
20,000,000 DR = = 10 2,000,000
20 - 10 APGR = = 1% 10
70 DT = = 70 years 1.0 %
Net Migration = 12,000 - 2,000 x 1000 2,000,000
Net Migration = 10,000,000 = 5 2,000,000
Adjusted Growth Rate = 5 + 1.0 10
Adjusted Growth Rate = + 1.0 = 1.5% 0.5