Download
1 / 46
490 likes | 750 Vues
Measuring Urban Design Reid Ewing Department of City and Metropolitan Planning University of Utah. Two Applications. Book by Island Press Street Life App for HUD Sustainable Communities Project. Hardest D to Operationalize. Work Plan. Expert Panel Literature Review with Definitions

E N D
Measuring Urban Design Reid Ewing Department of City and Metropolitan Planning University of Utah
Two Applications Book by Island Press Street Life App for HUD Sustainable Communities Project
Work Plan • Expert Panel • Literature Review with Definitions • Library of Video Clips • Visual Assessment Survey • Quantitative and Qualitative Analyses • Instrument Development, Testing, and Training • Illustrated Field Manual
National Expert Panel Victor Dover - urban designer Rob Lane - urban designer Geoffrey Ferrell - urban designer/code expert Tony Nelessen - urban designer Anne Vernez Moudon - urban designer/planner Mark Francis - landscape architect Michael Southworth - urban designer Michael Kwartler - architect/simulations expert John Peponis - architect/space syntax expert Dan Stokols - social ecologist
41 qualities 8 qualities Imageability Enclosure Human Scale Transparency Linkage Complexity Coherence Legibility Perceptual Qualities
Best Match RunHigh Values of Imageability, Human Scale, Linkage, and Tidiness
Best Match RunHigh Values of Enclosure, Transparency, Complexity, and Coherence
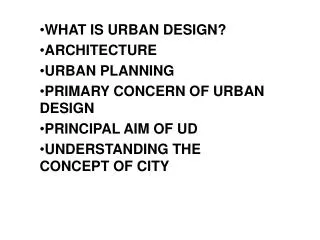
Field Manual Focuses on Urban Design Qualities that Meet Performance Criteria • Imageability • Enclosure • Transparency • Human scale • Complexity
Columbia U Follow-Up More Complete and Tested Field Manual Rating of 588 Street Segments in NYC Translation to GIS Based System Relationship to BMI
Pedestrian Counts • High Correlation Among Independent Counts • Google Street View (588 cases) • Bing StreetSide (169 cases) • EveryScape (201 cases) • Manual Counts (588 cases) • High Reliability Among Independent Raters • 30 segments • 3 raters
Google Street View 125 East 19th Street, Manhattan – BLOCK ID 128821-S
EveryScape 125 East 19th Street, Manhattan – BLOCK ID 128821-S
Bing 125 East 19th Street, Manhattan – BLOCK ID 128821-S
D Variables Density – Floor Area Ratio Diversity – Entropy based on floor area Design – Intersection Density Destination Accessibility – Walk Score Distance to Transit – Miles to Nearest Transit Line Demographics – Per Capita Income
GIS Layers 1. NYC planning "LION" geodatabase that contains road centerline file, address, borough code, zip etc. 2. NYC_ALR_Blockfaces – this is the dataset that contains the original drawn block-faces with scoring data attached 3. CenterlineDataBuffer – created from street segments and used to capture .25 mile radius of land use (and eventually LU, transit, and SE data) 4. MapPluto – NYC Planning land use data set at parcel level
Arlington County, VA’s Columbia Pike Special Revitalization District