Download
1 / 67
740 likes | 1.25k Vues
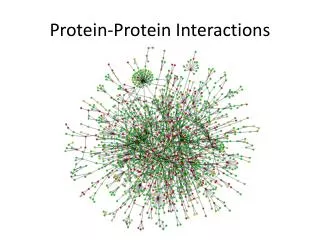
Protein-Protein Interactions Networks. “ A comprehensive analysis of protein-protein interactions in Saccharomyces cerevisiae ” P.Utez et al, Nature 2000 “ Functional organisation of the yeast proteome by systematic analysis of protein complexes ” G. Gavin et al, Nature 2002

E N D
Protein-Protein Interactions Networks “A comprehensive analysis of protein-protein interactions in Saccharomyces cerevisiae”P.Utez et al, Nature 2000 “Functional organisation of the yeast proteome by systematic analysis of protein complexes” G. Gavin et al, Nature 2002 “Global Mapping of the Yeast Genetic Interaction Network” Tong et al, Science 2004 “Global analysis of protein activities using proteome chips” Zhu, H. et al. Science 2001 “Conserved patterns of protein interaction in multiple species” R. Sharan et al, PNAS 2005
Genomics • Genomics –“The large scale study of genomes and their functions” • Why protein network?
19,500 genes 14,000 genes 24,000 genes 50,000 genes 26,000 genes Why protein network? • Assemblies represent more than the sum of their parts. • `complexity' may partly rely on the contextual combination of the gene products.
Saccharomyces cerevisiae Yeast as a model • Why yeast genomics? A model eukaryote organism …
The best-studied organism • ~5,500 genes. • 16(!) chromosomes. • 13 Mb of DNA (humans have ~3,000 Mb). • We know (?) the function of >1/2 of the yeast genes. • All the essential functions are conserved from yeast to humans.
Example: cell cycle Lee Hartwell, Nobel Prize 2001
4 methodologies for high throughput research • Two hybrid systems • Analysis of protein complexes • Synthetic lethal • Protein Chips (?)
Two hybrid system • Aim: • Identify pairs of Physical interactions. • Solution: • Use the transcription mechanism of the cell
DNA TRANSCRIPTION RNA TRANSLATION PROTEIN The central dogma 3
Transcription factors Movie – transcription (molecular model, real time) 7.2
Eukaryotic mRNA Reporter gene
Two hybrid system • Isolate double plasmids using reporter or selection methods.
Focus on the baits • Baits are analyzed separately. • 192 baits vs. ~6000 pray yeast strains. A component of RNA polymerase I, III, identification of three new interacting proteins
Two hybrid system • “A comprehensive two-hybrid analysis to explore the yeast protein interactome“ Ito T. et al, PNAS 2001.
Analysis of protein complexes • Aim: Identification of complexes and their sub units. • Solution: a two step method • Isolation of only relevant complexes • Identification of complex units.
Identification of the members • Divide and conquer- • Denaturate assembly • Digest with protease • Mass spectrometry
How does it work? • The deflection route of ionized molecules is used to determine the molecule’s mass. • The output:
Analysis of protein complexes • Cross results of peptide mass with protein database. • Mass spectrometry can be implied again if the data is not sufficient, this time for the peptides.
Analysis of protein complexes • Systematic(1): 1739 bait proteins. • 232 complexes with 589 baits. • Systematic(2): 725 bait proteins. • 3,617 interactions with 493 baits.
Analysis of protein complexes • About 25% false positive rate. • Covers 56/60%, 10/35% in Y2H, of known complexes. • Only 7% of the interactions were seen by Y2H assays. • But, • Can evaluate protein- • Concentration. • Localization. • Post-translational modifications.
Synthetic lethality • First, few words on essentiality. • Create new strains, each strain with one gene deleted (96% coverage) • Tag each strains with a unique sequence. • Grow all the strains. • Measure the amount of each seq. • Some 18.7% (1,105) are essential.
Synthetic lethality • High genetic redundancy hardens the discovery of many gene functions (30%). • Only the double mutation is lethal, either of the single mutations is viable. • Why? • Single biochemical pathway. • Two distinct pathways for one process. • …
The naïve approach • But how do you genomics it? …
All vs. All • ~5100 non essential mutants. • Main tricks: • 1. Haploid strains • 2. Resistant markers. • 3. Extra marker for the library haploid.
Synthetic lethality … Making it genomics • Mass analysis: Crossing the query haploid with a library (synthetic genetic array) • Tetrad analysis: Validation and finding synthetic sick
The genetic interaction map • 8 genes against all produced a network of synthetic lethal pairs.
Synthetic lethality … Making it genomics • 132 query genes vs. 4700 • False negatives – 17-42%. • At least 4 times more dense than the PPI network. • Predicting ~100,000 interactions (?)
PPI Summery • S. Cerevisiae (Yeast) • 4389 proteins • 14319 interactions • C. Elegans (Worm) • 2718 proteins • 3926 interactions • D. Melanogaster (Fly) • 7038 proteins • 20720 interactions Sharan et al. PNAS 2005
We like Networks • Exploit graph theory methods. • Provide a general solution for data integration.
Network Structure and Function • Identify highly nonrandom network structural patterns that reflect function: • Ideker et al: Finding co-regulated sub-graphs. • Lee at el: The repeated instances of each motif are the result of evolutionary convergence. • Barabasi at el: Network motifs are associated with specific cellular tasks. • …
Conserved patterns of PPI in multiple species Bacterial pathogen (Helicobacter pylori) ~1500 interactions ~700 interacting genes Baker’s yeast (Saccharomyes cerevisiae) ~15000 interactions ~5000 interacting genes Kelley et al. PNAS 2003
Goals • Separating true PPI from false positives. • Assign functional roles to interactions. • Predict interactions. • Organizing the data into models of cellular signaling and regulatory machinery. • How? • Use approach based on evolutionary cross-species comparisons.
Interaction graph (per species) • Vertices are the organism’s interacting proteins. • Edges are pair-wise interactions between proteins. • Edges are weighted using a logistic regression model: • A: Number of times an interaction was observed. • For Fly and worm observation In one experiment. • B: Correlation coefficient of the gene expression. • Shown to be correlated to interaction. • C: Proteins’ small world clustering coefficient. • Sum of the neighbors logHG probs.
How do we find Sub-network conservation? • Interactions within each species should approximate the desired structure: • Pathway. Signal transduction. • Cluster. Protein complex. • Many-to-many correspondence between the sets of proteins.
Network alignment graph • Each node corresponds to k sequence-similar proteins. • BLAST E value < -7; considering the 10 best matches only. • Cannot be split into two parts with no sequence similarity between them. • Edge represents a conserved interaction. • Match -> One pair of proteins directly interacts and all other include proteins with distance <2 in the interaction maps. • Gap –> All protein pairs are of distance 2 in the interaction maps. • Match-Gap-> At least max{2, k −1} protein pairs directly interact. • A subgraph corresponds to a conserved sub-network.
( ) q e å log q Î e P random A probabilistic model ( ) = S P q(e) – interaction similarity
Searching for conserved sub-networks • Identifying high-scoring subgraphs of the network alignment graph. • …This problem is computationally hard. • Exhaustively we find seeds - paths with 4 nodes. • Expand high scoring seeds. Greedily add/remove nodes. • Filter subgraphs with a high degree of overlap (>80%).
Statistical evaluation of sub-networks • Randomized data is produced: • Random shuffling of each of the interaction graphs. • Randomizing the sequence-similarity relationships. • Find the highest-scoring sub-networks of a given size. • P-value is computed by the distribution of the top scores.
← Bacteria → ← Yeast → ← Protein sequence similarity → The final product
3-way Comparison • S. cerevisiae • 4389 proteins • 14319 interactions • C. elegans • 2718 proteins • 3926 interactions • D. melanogaster • 7038 proteins • 20720 interactions Sharan et al. PNAS 2005
Multiple Network Alignment Subnetwork search Network alignment Preprocessing Interaction scores: logistic regression on #observations, expression correlation, clustering coeff. Conserved paths Filtering & Visualizing p-value<0.01, 80% overlap Conserved interactions Protein groups Conserved clusters
Reduced false positives • Compared these conserved clusters to known complexes in yeast - • Pure cluster - contain >2 annotated proteins and >1/2 of these shared the same annotation. • 94%(>83% in mono specie) pure clusters. • Did ‘‘sticky’’ proteins biased the clusters? • Of 39 proteins (> 50 neighbors), only 10 were included in conserved clusters. And they were annotated so.