
Optimum Bidding Strategies in Sequential Engineering Contracts: A Dynamic Programming Approach
Explore optimal bidding pricing in sequential engineering contracts, considering relationships, costs, and competitive advantage for long-term profits.

Optimum Bidding Strategies in Sequential Engineering Contracts: A Dynamic Programming Approach
E N D
Presentation Transcript
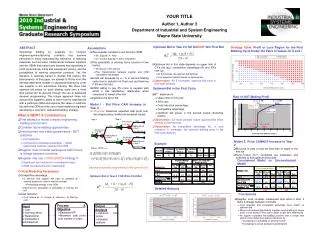
Year 2 Year 1 Won Bid Amount 2 2 2 in ( ) S B S 1 1 1 Won Bidding Result in Year 2 Bid Amount Did Not Win 1 1 in S (B ) 1 S Bidding Result Won in Year 1 Bid Amount 2 S 2 2 in ( ) B S 0 0 0 Did Not Win Bidding Result in Year 2 Did Not Win YOUR TITLE Author 1, Author 2 Department of Industrial and System Engineering Wayne State University Strategy Table:Profit or Loss Region for the First Bidding Cycle Under the Pairs of Values for δ and Optimum Bid in Year 2 if SX Did NOT Win First Bid ABSTRACT Sequential bidding by suppliers on complex engineering/manufacturing contracts has become pervasive in many manufacturing industries. In maturing industries, such as autos, relational ties between suppliers and the OEMs they serve have become key ingredients in profit performance, initial and subsequent pricing, and the probabilities of winning sequential contracts. Yet, the literature is relatively barren in studies that explore this phenomenon. In this paper, we attempt to fill this void. We develop alternative models of sequential bidding by a tier one supplier in the automotive industry. We show how optimum bid prices for each bidding cycle over a fixed time period can be derived through the use of backward dynamic programming. This unique approach takes into account the supplier’s ability to learn from its experiences with a particular OEM and explores the value of relational ties with that OEM and the use of loss-leader pricing when developing a long-term, sequential bidding strategy. Assumptions • Two supplier compete to win bid from OEM • SX: Supplier X - New • CY: Current Supplier Y (SX’s competitor) • The probability of winning bid is function of two factors • Bid prices of SX and CY • Prior Relationships between supplier and OEM (competitive advantage) • Costs will decrease by a % in second bidding cycle due to reduction in fixed cost and learning if SX won first bid • OEM willing to pay δ% more to supplier with which it has satisfactory relationship when compared to lowest other bid • Optimize the bid of SX • Optimum bid in this state depends on upper limit of CY’s bid (φU), competitive advantage (δ) and SX’s cost (μ1) • As δ increases, the optimum bid declines • Cost reduction has NO impact on optimum bid • Observation: As δ increases, optimum bid price in this state declines Optimum Bid in the First Cycle • B1* depends on • Upper limit of CY’s bid, • SX’s cost, • Cost reduction percentage, • Competitive advantage, • Optimum bid prices in the second period (therefore profits) • Observation:SX must consider future opportunities when bidding on first contract • Observation: As competitive advantage (δ), or cost reduction () increases, the optimum bidding price in the first cycle declines Risk of NOT Making Profit Model I - Bid Price CAN Increase in Year 2 • Objective: Maximize expected total profit over two stages using conditional expected values • What is NEW? & Contributions • First attempt to model complex engineering bidding environment • Consider future bidding opportunities • Introduce two new bidding parameters - NOT just price • Cost reduction • Competitive advantage parameter – reflect relationship between supplier and OEM • Supplier must consider subsequent bids if there is linkage between contracts • Supplier may use LOSS LEADER strategy if • Significant cost reduction in subsequent years • OEM considers the prior relationship Model 2: Price CANNOT Increase in Year 2 Example • Bid price in year 2 must be less than or equal to the first bid • Kuhn-Tucker (K-T) conditions are necessary and sufficient to find optimum bid prices Constrained Model vs. Unconstrained Model Backward dynamic programming finds optimum bid • Critical Modeling Parameters • Competitive advantage • δ: Amount new supplier will have to underbid an existing supplier in order to win first contract. • Percentage savings to the OEM • Factored into calculation of probability of winning the bid • Cost reduction • Cost reduce by % through a) Learning , b) Start-up cost Optimum Bid in Year 2 if SX Wins First Bid Detailed Analysis Conclusions • Supplier must consider subsequent bids when it bids, if there is linkage between contracts • Cost reduction and competitive advantage have impact on optimum bid • When cost reduces significantly, supplier may be willing to forego profit or lose money in first year to begin longer term relationship • As supplier considers the bidding problem over a longer time period, it can make more efficient decisions by • increasing the probability of winning the bid • increasing its annual average expected profit • Process & Objective • Backward DP • Maximize total profit over number of years • Output & Analysis • Optimum bid prices • Detailed analysis • Input • Cost • Learning effect • Relationship • Competitor’s estimated bid


