Download
1 / 1
10 likes | 191 Vues
Introduction Insulin sensitivity defines the metabolic balance between insulin concentration and insulin-mediated glucose disposal. When using exogenous insulin, variable insulin sensitivity can cause highly variable outcome glycaemia.

E N D
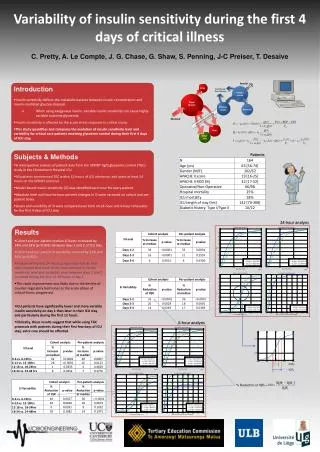
Introduction • Insulin sensitivity defines the metabolic balance between insulin concentration and insulin-mediated glucose disposal. • When using exogenous insulin, variable insulin sensitivity can cause highly variable outcome glycaemia. • Insulin sensitivity is affected by the acute stress response to critical injury. • This study quantifies and compares the evolution of insulin sensitivity level and variability for critical care patients receiving glycaemic control during their first 4 days of ICU stay. Variability of insulin sensitivity during the first 4 days of critical illness • Subjects & Methods • A retrospective analysis of patient data from the SPRINT tight glycaemic control (TGC) study in the Christchurch Hospital ICU. • All patients commenced TGC within 12 hours of ICU admission and spent at least 24 hours on the SPRINT protocol. • Model-based insulin sensitivity (SI) was identified each hour for every patient. • Absolute level and hour-to-hour percent changes in SI were assessed on cohort and per-patient bases. • Levels and variability of SI were compared over time on 24-hour and 6-hour timescales for the first 4 days of ICU stay. Patients 24-hour analysis • Results • Cohort and per-patient median SI levels increased by 34% and 33% (p<0.001) between days 1 and 2 of ICU stay. • Cohort and per-patient SI variability reduced by 32% and 36% (p<0.001). • Analysis of the first 24 hours using 6-hour blocks of SI data showed that most of the improvement in insulin sensitivity level and variability seen between days 1 and 2 occurred during the first 12-18 hours of day 1. • This rapid improvement was likely due to the decline of counter-regulatory hormones as the acute phase of critical illness progressed. • ICU patients have significantly lower and more variable insulin sensitivity on day 1 than later in their ICU stay and particularly during the first 12 hours. • Clinically, these results suggest that while using TGC protocols with patients during their first few days of ICU stay, extra care should be afforded. C. Pretty, A. Le Compte, J. G. Chase, G. Shaw, S. Penning, J-C Preiser, T. Desaive 6-hour analysis IQR2 IQR1 % Reduction of IQR =