Analysis of CCN3/NOV and CCN2/CTGF mRNA Expression in Hepatic Cells Over Time
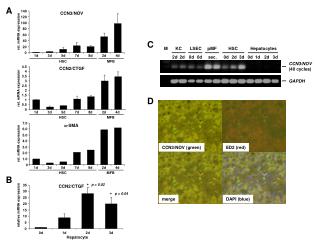
This study investigates the relative mRNA expression of CCN3/NOV and CCN2/CTGF in hepatic cells, specifically in hepatic stellate cells (HSC), myofibroblasts (MFB), and hepatocytes, measured over various time points (0d, 1d, 2d, 3d, 4d, 5d, 7d, 8d). The expression data includes a relative expression analysis with GAPDH as a control, utilizing fluorescent markers (DAPI, ED2) to visualize cellular components. Significant findings indicate differential expression patterns associated with cellular transitions, supported by statistical analysis (p-values indicating significance).

Analysis of CCN3/NOV and CCN2/CTGF mRNA Expression in Hepatic Cells Over Time
E N D
Presentation Transcript
A 140 CCN3/NOV 120 100 80 rel. mRNA expression 60 C 40 M KC LSEC pMF HSC Hepatocytes 20 0 2d 2d 0d 0d sec. 0d 2d 3d 0d 1d 2d 3d 1d 3d 5d 7d 8d 2d 4d HSC MFB CCN3/NOV (40 cycles) 4.5 CCN2/CTGF 4 3.5 GAPDH 3 2.5 rel. mRNA expression 2 1.5 D 1 0.5 0 1d 3d 5d 7d 8d 2d 4d HSC MFB 7.0 -SMA 6.0 5.0 4.0 rel. mRNA expression CCN3/NOV (green) ED2 (red) 3.0 2.0 1.0 0 1d 3d 5d 7d 8d 2d 4d HSC MFB B p = 0.02 35 CCN2/CTGF 30 p = 0.04 merge DAPI (blue) 25 20 relative mRNA expression 15 10 5 0 0d 1d 2d 3d Hepatocyte