Download
1 / 53
530 likes | 620 Vues
Explore the impact of dialysis prescriptions and practices on patient outcomes over a span of 20 years, with a focus on mortality, morbidity, and quality of life. This study delves into international outcome comparisons, the influence of dialysis prescriptions, and ways to enhance dialysis practices. Key topics covered include treatment time, blood pressure, phosphorus levels, and vascular access use. Uncover the nuances of patient mortality rates across different regions and practice patterns, shedding light on potential improvements for better patient care and outcomes.

E N D
Impact of Dialysis Prescriptions and Practices on Outcomes Friedrich K. Port, MD, MS Arbor Research Collaborative for Health Ann Arbor, Michigan ESRD State of the Art, Boston, MA. April 23-26, 2009
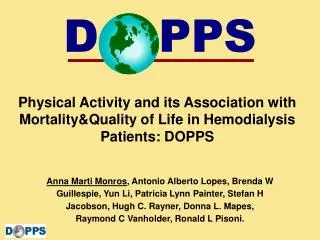
DOPPS Overview • Prospective observational study, 1997 – 2011 • Representative HD samples in 12 countries • Practice-patterns in dialysis facilities and outcomes • 4 Phases: consistent data collection internationally • DOPPS 2: Added focus on incident HD patients • DOPPS 3: Added processes of care and nutrition • DOPPS 4*: Added practice trends and MD opinions • Goal: Improve Outcomes in Hemodialysis: - Mortality, Morbidity, and Quality of Life * 2009-2011 funded by Amgen, Kyowa Hakko Kirin, and Genzyme
Dallas Conference, 1989 • Held PJ, Brunner F, Odaka M, Garcia J, Port FK, Gaylin DS: Five-year survival for ESRD patients in the U.S., Europe, and Japan 1982-87. Am J Kidney Dis 1990; 15: 451-457. • US survival is lower than EDTA or Japan: Why • US captures all deaths, other registries don’t (?) • US case mix or practices explain the differences • Mortality differs in the general populations • Were authors simply wrong?
Outline • International outcome comparisons • Are outcomes differences real? • Can we explain outcomes difference? • Dialysis prescription over the last 20 years • Opportunities to improve practices in dialysis • Treatment time, at same Kt/V • Blood pressure • Phosphorus • Focusing analyses on Practice Patterns may improve evidence and have practical implications
5-Year Survival for ESRD Patients Based on Registries, Adjusted for Diabetes and Age 5-YearSurvival(%) US EDTA US Japan Includes all dialysis and transplant patients Held et al. AJKD 15: 451, 1990 U 277 99
DOPPS I: Survival Among Hemodialysis Patients in Japan, Europe, and the United States: Adjusted for demographics and comorbidities Unadjusted Survival (%) US/EU RR =1.33 Years Years DA Goodkin et al. JASN 14: 3270-3277, 2003
Mortality in the General Population versus the Dialysis Patient Mortality Nathan Levin’s Hypothesis: In international comparisons, higher dialysis patient mortality is partly explained by higher mortality in the general population Methods: Correlate WHO data with Registry + DOPPS data Yoshino et al JASN 2006, 17:3510-3519
Relationship of All-Cause Mortality Rates Between Dialysis Patients (DP) and General Population (GP) Unadjusted: Yoshino et al JASN (2006)
Relationship of All-Cause Mortality Rates Between Dialysis Patients (DP) and General Population (GP) Adjusted for age in DP (overall median mean age [60.4 yr]) and GP (overall median percentage of population aged 65 yr [15.8%]). N=21 countries. Yoshino et al JASN (2006)
International Differences • Differences confirmed for US versus EU using detailed adjustment for case mix and same data collection for death ascertainment • Better outcomes in Japan may be exaggerated since selection to transplant of healthier patients is minimal in Japan • Background mortality partially explains differences* • Question: Do practice differences contribute?
Outcomes by Vascular Access Use:Problems with patient-based analyses • Patients who use a catheter for dialysis tend to be sicker patients • Patients using a catheter have higher mortality than patients using an AV fistula • Is the higher mortality due to catheter use or due to the selection of sicker patients? The use of catheters varies widely from facility to facility even when adjusted for case mix. This may be a practice pattern: In DOPPS we studied overall mortality in facilities by level of catheter use Pisoni et al. AJKD 2009, 53: 475-491
Vascular Access Use and Mortality Risk Facility-Based Model RR of Death among Facility Patients per 20% more facility use of indicated access type p<0.0001 p=0.008 Ref. Ref. p<0.0001 p<0.0001 *DOPPS I+II, 1996-2004; n=27,892; adjusted for age, gender, black race, yrs with ESRD, 14 comorbidity classes, weight, other practice indicators (median treatment time, % of pts with S. Ca >10 mg/dl or S. PO4 >5.5 mg/dl) whether hosp unit, & accounted for facility clustering; stratified by study phase & region. Facility access use is adjusted for facility case-mix.
Mortality Risk in Facilities that have Greater Use of Catheters or AV Grafts versus low use RR of death Fac. Catheter Use(R2=0.95) Fac. Graft Use(R2=0.966) Quintiles for Graft and Catheter Use % Adjusted Facility Access Use
Adjusted for Case Mix 1.36 1.06 1.00 1.00 US EUR US EUR Mortality Risk for US versus European DOPPS is Largely Explained by Vascular Access Practice RR of Death 1.5 + Adjusted for Facility Vascular Access Practice 1 p<0.0001 p=0.43 0.5 All models were adjusted for age, gender, race, time on dialysis, 14 summary comorbid conditions, weight, unit type, facility median treatment time, facility % pts with serum phos > 5.5 and serum Ca> 10 mg/dl, and stratified by study phase; accounted for facility clustering effects. DOPPS I + II; n=24,398; *EUR=France, Germany, Italy, Spain, and UK.
International Differences • Differences confirmed for US versus EU using detailed adjustment for case mix and same data collection for death ascertainment • Better outcomes in Japan may be exaggerated since selection of healthier patients to transplant is minimal on Japan • Background mortality partially explains differences • Differences in vascular access practice explain most of the mortality differences between Europe and US: This points to an opportunity to improve vascular access care and outcomes in the US
Dialysis Prescription • Kt/V Trends • Treatment time (TT) and mortality risk (independent of Kt/V)
Mean Single-pool Kt/V in US HD Patients during the Past 20 Years sp Kt/V Cross-sections of patients by year U S D O P P S DOPPS 1 DOPPS 2 DOPPS 3 U S R D S S p e c i a l S t u d i e s CMMS CMAS DMMS Year Adapted from Port et al. CJASN 1:246-255, 2006
Mean and Median Patient Prescribed Treatment Time in the US, by DOPPS Phase* Minutes Mean Median (n=3,856) (n=2,260) (n=1,814) *Prevalent Cross-section of patients in each phase, weighted to represent total facility sample size.
Distribution of Facility Treatment Time by Country and Phase Mean Facility Treatment Time (min) Phase ANZ Be Ca Fr Ge It Ja Sp Sw UK US Box-plots show the 25th to 75th percentiles (box) with median (line) and 5th and 95th percentiles (whiskers)
Mortality Risk by Average Facility Treatment Time as a Practice Pattern RR Mortality* RR=0.96 per 15 minutes, p=0.03 p=0.04 Ref. p=0.26 *Adjusted 2-stage model (instrumental variable)
Treatment Time and Mortality:Summary • Patients treated with longer dialysis sessions have lower mortality risk at the same Kt/V (Saran et al 2008) • Patients treated in dialysis facilities that use on average longer treatment times have lower mortality (this analysis focuses on the practice and minimizes bias due to patient health status) • The agreement of these results enhances the level of evidence
Predialysis Systolic Blood Pressure and Mortality Risk A New Analytical Approach Using Patient Exposure to Different Practices
— Prevalent HD Patients — Facility Median Pre-dialysis SBP, by Region Substantial Variation Between Facilities and Regions Japan North America EU & ANZ Median Facility Pre-dialysis SBP 25th = 147 mmHg 75th = 161 mmHg 25th = 142 mmHg 75th = 153 mmHg 25th = 131 mmHg 75th = 145 mmHg N of facilities = 150 84 62 *Based on initial prevalent cross section patients (n=8000) with ESRD >3 months in 296 facilities in DOPPS III (2005-2008). SBP=systolic blood pressure
Within-Facility Distribution of Pre-Dialysis SBP* Substantial Variation Across a Wide BP Range % of Pts in Facilities <100 100-110 110-120 120-130 130-140 140-150 150-160 160-170 170-180 ≥180 Pre-Dialysis SBP (mmHg) * 22,559 initial prevalent cross section patients with ESRD duration > 180 days from 919 facilities in DOPPS I, II, III
Facility Level BP RR for an additional 10% of patients compared to the ref category RR of death§ 1.4 1.15 * 1.15 * * 1.3 1.03 1.2 1.01 1.1 1.0 1.00 0.9 0.99 Ref 0.8 0.97 *P<0.05 Ref 0.89 0.7 0.6 110 120 130 140 150 160 170 180 Pre-dialysis SBP Group (mmHg) Pre-HD Systolic BP and All-Cause Mortality Patient Level BP RR of death§ * * * 110 120 130 140 150 160 170 180 Pt achieved pre-dialysis SBP (mmHg) § 21,388 prevalent HD, 919 facilitiesExcludes patients with SBP <110 mm Hg. Cox models adjusted for age, gender, black race, BMI, vintage, study phase, hemoglobin, s. albumin, phosphorus, creatinine, ferritin, PTH, intra-dialysis weight loss, treatment time,catheter use, 13 comorbidities, stratified by country and accounted for facility clustering. Facility level model also adjusted for facility mean levels of intra-dialysis weight loss, dialysate sodium, and treatment time (min), % of catheter use and % pts in albumin, Hgb, Kt/V, and phosphate guidelines. No meaningful change with the addition of anti-hypertensive medications to the models, or with the addition of pts with SBP<110.
Facility Predialysis Systolic BP and All-Cause Mortality Facility Level Mortality RR per an additional 10% of patients by category compared to the reference RR of death * * Ref * p <0.05 110-129 130-160 >160 Pre-dialysis SBP (mmHg)
Predialysis Blood Pressure Levels and Survival: Summary • Optimal target BP has been difficult to identify, because BP is influenced by health status • Facility-based analyses provide insights by minimizing bias due to patient health status, and by taking advantage of the large between-facility variation in BP as a likely reflection of practices or MD opinion • Our data show that: • Patients treated at facilities where more patients have low pre-dialysis SBP (110-130 mmHg) have higher mortality risk • Patients treated at facilities where more patients have high pre-dialysis SBP (>160 mmHg) have higher mortality risk
Predialysis Blood Pressure Levels and Survival: Conclusion • These facility-level findings suggest that both higher predialysis SBP (>160 mmHg) and lower SBP (<130 mmHg) are associated with elevated mortality risk • The present results are not consistent with KDOQI Guidelines (SBP <140 mmHg) • A clinical trial is needed to identify optimal predialysis SBP goals
Serum Phosphorus and Mortality Risk Patient-based analyses and Practice-based analyses
Practices of Better Control of High Phosphorus and Mortality Risk BACKGROUND: • Patient level analyses showing higher mortality in patients with high P levels may be confounded, if sicker patients have higher P levels • The new KDIGO Guidelines recommend control “toward normal P levels” since randomized trials are lacking • Since randomization to poor P control is not feasible, can we make observational studies more informative?
HR All-cause Cardiovascular 4.0 3.5 3.0 2.5 2.0 1.5 1.0 0.5 0 0.5 1.5 2.5 3.5 4.5 5.5 6.5 7.5 8.5 9.5 10.5 mg/dl Mortality Risk by Phosphorus CategoriesPatient-Level Analyses, Among Patients on HD > 180 days Cox models used all DOPPS (n=25,529) and adjusted for age, sex, race, BMI, years on ESRD, 13 comorbid conditions, facility clustering. Hazard ratios and 95% confidence intervals (whiskers) for all-cause (events n=5,857) and cardiovascular mortality (n events=1,930) Tentori et al. AJKD 2008
Variation in Facility-Level Serum Phosphorus Facility % of Patients N=899 facilities Serum Phosphorus (mg/dl) The % of patients having a serum PO4 of >7 mg/dl varies from 3% in some facilities to 40% of patients in other facilities.
Facility-Level Serum Phosphorus versusAll-Cause and CV Mortality RisksAmong Patients on HD > 180 days +95% C.I. Ref Hazard ratios and 95% confidence intervals (whiskers) for all-cause (events n=5,857) and cardiovascular mortality (events n=1,930). Models (n=20,561) were stratified by study phase and region and adjusted for facility clustering effect; baseline patient age, sex, race, BMI, time on ESRD, 13 comorbid conditions, hemoglobin, albumin, normalized protein catabolic rate, single-pool Kt/V, prior parathyroidectomy, and vitamin D prescription; the percentage of patients at a facility with serum calcium <8.5, 8.6-10, and >10 mg/dL; and the percentage of patients at a facility with serum PTH <100, 101-300, 301-600, and >600 pg/mL. Tentori et al AJKD 2008
Can we use Principles of Randomization in Observational Studies? If patients are assigned randomly to facilities: Yes • Instrumental variables may reduce treatment by indication bias • This is useful when large differences in practice are observed • In DOPPS, we use facility-level treatment variables as instrumental variables
Facility-Level Treatment VariablesRationale in DOPPS Design • Patients usually select dialysis facilities by factors independent of their own medical condition – e.g. by proximity to home • Average treatment patterns differ substantially among facilities, in part due to provider opinion or preferences
Facility-Level Treatment Variables • Since variations in treatment preferences are likely “random” with respect to medical condition, this provides a “natural experiment” with advantages similar to randomization in a clinical trial • Randomization provides balance across both measured and unmeasured confounders
Facility-Level Treatment Variables as Instrumental Variables: Caveats • Other treatment practices may vary together with the treatment of interest • Action: We adjust also for other treatment practices • Unmeasured treatment practices may be confounders • Action: We measure many practices
Impact of Dialysis Prescriptions and Practices on Outcomes: Summary • The DOPPS approach has allowed identification of opportunities to improve practices and outcomes, e.g. • Treatment time (>4 hours thrice weekly) • Systolic Blood pressure (130-160 mmHg pre-dialysis) • Phosphorus (Avoid PO4 >6 mg/dl) • International outcome differences are confirmed and the US-Euro difference is largely explained by case-mix and vascular access: Need to improve vascular access • The instrumental variable approach is useful when based on large differences in actual clinical practice
Acknowledgements • Thanks to participating DOPPS facilities for their data submission and dedication, and to patients for completing questionnaires • DOPPS is supported by scientific research grants without restrictions on publications from • Amgen (1996-2011) • Kyowa Hakko Kirin (1999-2011 in Japan) • Genzyme (2009-2011)
Tightness of Hgb Control* and Mortality Risk Among Facility Patients * measured as facility standard deviation of Hgb levels
Facility Hgb Standard Deviation (measure of “tightness of Hgb control” among facility patients) Patients (%) Facility with Std Dev = 1.0 g/dl Facility with Std Dev = 3.0 g/dl Some facilities may have larger variation (standard deviation) in patient hemoglobin levels. This may be due to: (1) greater comorbidity and variation in ESA-responsiveness among patients in some facilities (2) differences in facility practices that impact anemia control
Variation in Facility Hemoglobin Standard Deviation Facilities (%) The mean facility Hgb level did not significantly correlate with the facility Std Deviation of Hgb Facility Standard Deviation (g/dl) for Hgb Levels among Facility Patients n=921 facilities, DOPPS I, II, and III;Facility Hgb Std Dev based upon a prevalent cross-section of study patients in a facility at start of each DOPPS phase on dialysis > 180 days
Facility Std Deviation in Hemoglobin Levels and Mortality Risk Relative Risk of death RR= 1.10 per 0.5 unit higher Std Dev (p=0.001)Adjusted for Facility Mean Hgb Levels Ref p=0.10 p=0.0003 p=0.003 Facility Std Dev for Hgb Levels Adjusted for age, gender, black race, years with ESRD, body mass index, 14 comorbidity classes and facility mean Hgb level; stratified by country and phase; accounted for facility clustering effects; n=23,245, DOPPS 1 to 3. Facility hgb std dev based upon facility prevalent cross-section, pts on dialysis > 180 days
Facility Std Dev in Hemoglobin Levels and Mortality Risk Relative Risk of death RR= 1.11 per 0.5 unit higher Std Dev (p=0.002)Adjusted for Facility Mean Hgb Level plus adjusted for 6 other facility practices Ref p=0.23 p=0.002 p=0.0008 Facility Std Dev (g/dl) for Hgb Levels Adjusted for age, gender, black race, years with ESRD, body mass index, 14 comorbidity classes and facility mean Hgb level and the facility practice of treatment time, Kt/V, catheter use, serum Ca and PO4, and mean ESA dose; stratified by country and phase; accounted for facility clustering effects; n=23,245, DOPPS 1 to 3. Facility hgb std dev based upon facility prevalent cross-section, pts on dialysis > 180 days
Average Std Deviation in Hemoglobin by Country & DOPPS Phase* Ave of Facility Std Dev, g/dl Spain UK ANZ Italy Germany France UK Canada US Sweden Japan Belgium Japan *Baseline prevalent cross-section of patients on dialysis > 180 days for each country & phase. Restricted to facility with at least 12 observations
Practices Associated with Tighter Hgb Control at Facility Level • Having a narrower Hgb target range • Adjusting ESA dose more often (at least monthly) • Checking Hgb levels more often (at least weekly) • Prescribing ESAs for more patients (higher %) • Giving ESA i.v. rather than subcutaneously
Tighter Hgb Control at Facility Level*Summary Tighter Control of Hemoglobin at the Facility Level • is associated with lower adjusted mortality at the facility • is associated with certain practice patterns • appears to be feasible according to the observed improvements over time in most countries * i.e. smaller standard deviation of Hgb across patients
Distribution of Facility Mean TT, by Region and Phase * * * * # n = 546 facilities TT=Treatment Time * p <0.05 vs US of same phase # p <0.05 vs US DOPPS I Saran et al. KI 69: 1222-8, 2006