Download
1 / 27
270 likes | 386 Vues
Learn about the key Kuali Financial System (KFS) chart features, organization hierarchies, extended attributes, and how to lay the groundwork for a successful chart of accounts implementation. Explore experiences and challenges faced by Cornell University, UC Santa Barbara, and the University of Arizona.

E N D
Building a Kuali Chart of Accounts Jim Corkill, University of California, Santa Barbara Mark McGurk, University of Arizona Kim Yeoh, Cornell University
Agenda • Key KFS Chart Features • Laying the Groundwork • Experiences and Challenges - Cornell University - UC Santa Barbara - University of Arizona
KFS Chart Features • Chart • Ability to have multiple charts • Charts are hierarchical • Organization • Hierarchical • Facilitates reporting, workflow, controls • Account/Sub-Account • Report up through organizations • Allows for further division of an account for internal reporting purposes
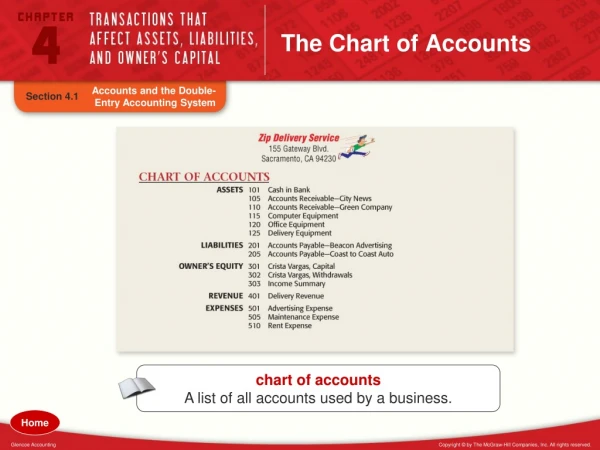
Organization Hierarchy with Accounts/Sub-Accounts University of California System University Campus University of California at Santa Barbara (UCSB) College College of Science - 3100 Department Physics - Unit 3102 Program A Program B Astrophysics Account Account 111480 Black Hole Research Sub-Acct 1 Sub-Acct 2 4801 Cost Share
KFS Chart Features Extended Attributes • Can be used throughout Chart (e.g. Orgs, Accounts, Object Codes, etc.) • What is it? • Additional field to “tag” chart objects with a unique identifier • How to use • Use to “link” chart objects that are not naturally linked for reporting purposes – i.e. tool for pre-existing reporting requirements that don't fit neatly into hierarchical structure • Example • Interdepartmental activities, link unrelated organizational units (cross functional teams, etc.), inter-disciplinary activities
Laying the Groundwork General questions to consider: • Just because it can be changed, should it? • What currently works, what doesn’t? • Implications for historical comparisons • What are the reporting requirements? • Institutional financial reporting (external) • Summarized management reporting • Departmental detail • Ad hoc reporting
Laying the Groundwork Chart questions to consider: • Does the institution need multiple charts? • For separate campuses • For auxiliary operations • For high level institutional financial reporting • Will interfaced systems be able to accommodate multiple charts? • Will it add confusion for users?
Laying the Groundwork Organization questions to consider: • What should be the basis for the organizational hierarchy? • Lines of authority • Lines of business (disciplines, auxiliaries, etc.) • Financial reporting requirements • How should the org structure relate to other administrative systems (e.g. HR)? • Do orgs need to be grouped in a way other than hierarchical? • How narrowly should org attributes (e.g. type) be defined?
Laying the Groundwork Account questions to consider: • Should existing account structure be preserved or should entirely new structure be created? • If new structure is used, can a map from old to new be created? • Should fund/sub-fund attribute perpetuate fund accounting or represent a different way of grouping accounts? • Should accounts be self-balancing, or should the institution use the “flexible claim on cash” option? • How should sub-accounts be used?
Cornell University Cornell Environment • Decentralized campus • High level and broad support • Varying receptiveness to change • “Homegrown” system on mainframe • Third financial system discussed
Cornell University Campus Involvement • Demos of FIS (Feb – Apr ’05) • KFS Release 1 Demos (Apr – Aug ’06) • Local COA team (Jun ’05 – present) • Kuali Days • Kuali Implementation Team (Jan ’07 – present) • meetings with campus financial leaders • inventory of current business processes, reports, and interfaces (both central and campus)
Cornell University Cornell Chart of Accounts Team • Membership • main KFS implementation group • central financial affairs staff (accounting, reporting, business analysts) • college/unit financial officers • budget and planning office staff • Objectives • compare and contrast the IU/KFS chart structure at a conceptual level with Cornell’s • determine how the chart fields will be used to meet the university’s financial management and reporting needs • identify any gaps that exist
Cornell University Challenges • Thinking “out of the box” • organizational hierarchies • self-balancing accounts vs. flexible offsets (assets and liabilities as object codes, not accounts) • Making sense of current attributes • Standardization vs. flexibility • What rules should be established?
Cornell University Challenges • Meeting reporting requirements • external vs. management reporting • FASB vs. GASB • faculty reporting • “funding year” reporting • Coming to consensus!
University of California, Santa Barbara Challenges • Where do we start? Solutions • Created a UC Kuali Team, consisting of campus project managers, programmers, and controllers, with a shared vision of a UC Kuali
University of California,Santa Barbara Challenges • Will Kuali work for us? Our biggest concern is the Chart of Accounts. Solutions • Document our current Chart of Accounts • Perform a Gap-Fit analysis with our COA and Kuali • Hired rSmart for the analysis
University of California,Santa Barbara Challenge • Our Current Chart of Accounts utilizes a data element called “fund” (different than the Kuali “fund”), which identifies funding source and used by our Office of the President for reporting Solution • Use the “Extended Attribute” in Kuali to accommodate “fund” information
University of California, Santa Barbara Challenge • Each campus has a different Chart of Accounts, yet we rollup as one for financial reporting Solution • Kuali enables multiple charts, which would allows for consolidated reporting.
University of California, Santa Barbara Next Steps • Evaluate Results of the Gap-Fit Analysis • Options for Implementation • Potential for Data Migration • Reviewing one module at a time with the help of campus SMEs and consultants when needed
University of Arizona Starting the Conversation • Meet with campus business leaders • Demo application or mocks • Include campus in KFS SME teams • Develop implementation plan with Central IT group/Administration involvement
University of Arizona 3 Data Conversion Points • Accounts • FRS – Current many to one vs. self balancing • Balance sheet general ledger (assets, liabilities, FB) • Sub-ledgers for income & expense (many accounts) • Vendor File/Purchasing • Fixed Assets
University of Arizona Conversion of Object Codes • Determined we need 2 Charts • Institutional Chart • AHSC • Main Campus • Management or Reporting Chart • Roll-up for Financial Reporting
University of Arizona Unit Hierarchy • Utilize Budget Roll-up Structure • (e.g. Executive – College – Dept.) • Allow creation of sub-units within • (e.g. Dept. – Sub. Dept.) • Prohibit creation of roll-up of units at this time • (e.g. Dept. – Dept. – Dept. = Unit)
Kuali Financial Systems Questions?