Download
1 / 35
370 likes | 568 Vues
Monitoring Volcanic Eruptions with a Wireless Sensor Networks. Geoffrey Werner-Allen, Jeff Johnson, Mario Ruiz, Jonathan Lees, and Matt Welsh Harvard University EWSN ’ 05 Presented by Tim. Outline. Introduction Background System Design

E N D
Monitoring Volcanic Eruptions with a Wireless Sensor Networks Geoffrey Werner-Allen, Jeff Johnson, Mario Ruiz, Jonathan Lees, and Matt Welsh Harvard University EWSN’05 Presented by Tim
Outline • Introduction • Background • System Design • Deployment • Distributed Event Detection • Evaluation • Conclusion
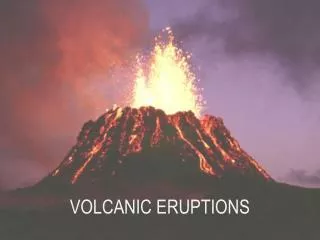
Introduction • Volcanic monitoring has a wide range of goals, related to both scientific studies and hazard monitoring. • Volcanologists currently use wired arrays of sensors to monitor volcanic eruptions. • Wireless sensor networks have the potential to greatly benefit studies of volcanic activity.
Background • Infrasound (Infrasonic wave) • Sound with very low frequency (1~50Hz) • Very high amplitude but not audible • Seismic wave • Wave travels through the Earth, often as the result of an earthquake or explosion
Challenges and Issues • Existing data loggers store data locally • e.g., 1 or 2 Gb microdrives, store about 15 days' worth of data • Must trek up to the station to retrieve the data • Usually very inaccessible: can take several hours to drive/hike in • Very high power consumption • Two car batteries plus solar panels to recharge • Very expensive • Individual data logger costs thousands of $$$ • Still need PCs/laptops to process and store data permanently • Hard to deploy large number of stations • Size, cost, power requirements,...
Opportunities for wireless sensor networks • Data sampling rates of ~100 Hz • Very small, low power, easy to deploy • Can put out a larger number of sensors in an area • Can customize software on the motes for capture, preprocessing, etc.
Outline • Introduction • Background • System Design • Deployment • Distributed Event Detection • Evaluation • Conclusion
Infrasound Node • Sample data continuously at 102.4Hz • A set of 25 consecutive samples is packed into a 32-byte packet and transmitted at approximately 4 Hz. • The aggregator will send acknowledgement back. If source node does not receive ack, it’ll retransmit up to 5 times.
GPS Receiver Node • Motes record sample # and GPS time seq # in message • Can be used to align samples from each mote
Time Regression • Uncertainties • The sampling rate of individual note may vary slightly over time, due to changes in temperature and battery voltage. • The log do not record the precise time. • Apply a linear regression to the data log stream and map individual sample to a “true ” time.
Outline • Introduction • Background • System Design • Deployment • Distributed Event Detection • Evaluation • Conclusion
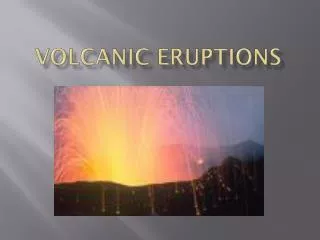
Volcano Tungurahua • Active volcano in central Ecuador – 5018 m • Site of much ongoing seismological research
Deployment • Three infrasound nodes, one central aggregator node and a GPS receiver. • The GPS receiver and FreeWave modem were powered by a 12 V car battery. All other nodes were powered by 2 AA batteries. • The distance between sensors and observatory is about 9km. • The deployment was active from July 20–22, 2004 and collected over 54 hours of infrasonic signals.
Data Analysis- Loss Rate • Weather conditions (e.g., rain) affected radio transmission. • Mote 4 experienced very low loss, due to its position with line-of-sight to the receiver. • Mote 3 experienced higher loss, probably due to antenna orientation.
Data Analysis- Correlation • The result of wireless sensor array shows high correlation with wired station.
Outline • Introduction • Background • System Design • Deployment • Distributed Event Detection • Evaluation • Conclusion
Distributed Event Detection • The initial deployment is not feasible for larger arrays deployed over long period of time. • To save bandwidth and energy, it is desired to avoid transmitting signals when the volcano is quiescent.
Mechanism • Each node samples data continuously at 102.4 Hz. • When the local event detector triggers, the node broadcasts a vote message. • If any node receives enough votes from its neighbor nodes, it initiates global data collection by flooding a message to all nodes in the network. • Token-based scheme for scheduling transmissions. • The order depends on node ID.
Local Detector Design • Threshold-based detector • Exponentially weighted moving average based detector
Local Detector Design • Threshold-based detector • Triggered whenever a signal rises above Thi and falls below another Tlo during some time window W. • Because it relies on absolute thresholds, it is sensitive to particular microphone gain on each node.
Local Detector Design • Exponentially weighted moving average based detector • For each sample, calculate two moving averages with different gain parameters, αshort ,αlong ,and compare the ratio of the two averages. • e.g., (αshort = 0.05,αlong =0.002) • If the ratio exceeds some threshold T (i.e., the short-term average exceeds the long-term average by a significant amount), the detector is triggered.
Outline • Introduction • Background • System Design • Deployment • Distributed Event Detection • Evaluation • Conclusion
Evaluation • Use 8 mica2 nodes in the lab, but only 4 nodes with infrasound sensor board. • The infrasound signals were produced by closing the lab door. • Three parts • Energy usage • Bandwidth usage • Detector accuracy
Energy usage • Each node exhibits a baseline current draw of about 18mA and supply voltage is 3 V. • Assuming that nodes detect a correlated signal every ½ hours, and locally vote at twice this rate.
Bandwidth usage • Continuous sampling scheme consumes nx4x32 bytes/sec of bandwidth • (n:# of nodes, each node transmit one pkt every ¼ sec, size of pkt :32bytes) • Because of the low frequency of eruptions, distributed event detection uses less bandwidth.
Detector Accuracy • Fed the detectors with the complete trace of data recorded on Tungurahua.
Future Work & Conclusion • Seismology presents many exciting opportunities for wireless sensor networks. • To expand the number of sensors in the array and distribute them over a wider aperture. • The long-term plans are to provide a permanent, reprogrammable sensor array on Tungurahua.
My Comments • The idea is simple but it’s hard work to deploy the motes in such a place. • To do research needs lots of passion. • The first mote-based application to volcanic monitoring! • Provide a wealth of experience to develop more sophisticated tools.