Guiding Landscape Conservation for Priority Bird Species
Enhancing conservation actions to sustain priority bird populations through effective landscape planning and management strategies. Addressing challenges and expectations in joint venture implementation.

Guiding Landscape Conservation for Priority Bird Species
E N D
Presentation Transcript
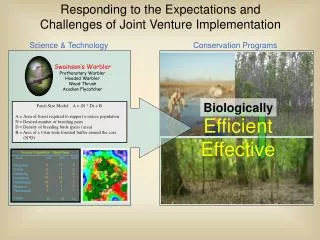
Responding to the Expectations and Challenges of Joint Venture Implementation Science & Technology Conservation Programs Swainson’s Warbler Prothonotary Warbler Hooded Warbler Wood Thrush Acadian Flycatcher Patch Size Model: A = (N * D) + B A = Area of forest required to support a source population N = Desired number of breeding pairs D = Density of breeding birds (pairs / area) B = Area of a 1-km wide forested buffer around the core (N*D) Source Population Objectives State 10K 20K 100K 9 0 2 19 14 6 1 11 1 1 15 6 1 1 3 0 0 7 2 0 1 Arkansas Illinois Kentucky Louisiana Mississippi Missouri Tennessee Totals 51 36 13 Biologically Efficient Effective
Responding to the Expectations and Challenges of Joint Venture Implementation Science & Technology Swainson’s Warbler Prothonotary Warbler Hooded Warbler Wood Thrush Acadian Flycatcher Patch Size Model: A = (N * D) + B A = Area of forest required to support a source population N = Desired number of breeding pairs D = Density of breeding birds (pairs / area) B = Area of a 1-km wide forested buffer around the core (N*D) Source Population Objectives State 10K 20K 100K 9 0 2 19 14 6 1 11 1 1 15 6 1 1 3 0 0 7 2 0 1 Arkansas Illinois Kentucky Louisiana Mississippi Missouri Tennessee Totals 51 36 13 Conservation Programs Landscapes That Sustain Populations Of Priority Species At Prescribed Levels Improving the Biological Efficiency and Effectiveness of our Conservation Actions
Responding to the Expectations and Challenges of Joint Venture Implementation WHAT Landscapes That Sustain Populations Of Priority Species At Prescribed Levels WHERE WHEN HOW MUCH HOW MUCH MORE Science & Technology Conservation Programs Improving the Biological Efficiency and Effectiveness of our Conservation Actions
Responding to the Expectations and Challenges of Joint Venture Implementation WHAT Landscapes That Sustain Populations Of Priority Species At Prescribed Levels WHERE WHEN HOW MUCH HOW MUCH MORE Conservation Enterprise – Planning– – Implementation – – Monitoring – – Evaluation – –Research – Function As An Iterative Whole Science & Technology Conservation Programs
Target:Landscapes That Sustain Populations Of Priority Species At Prescribed Levels
PRIORITY SPECIES Forest patches should be of sufficient size to support source populations. Fragmentation Nest Parasitism Nest Predation Land Conversion - How should birds be buffered from predation/parasitism? - What constitutes a source population? - What density do birds occur within the habitat? Target:Landscapes That Sustain Populations Of Priority Species At Prescribed Levels Swainson’s Warbler Cerulean Warbler Swallow-tailed Kite Prothonotary Warbler Northern Parula Hooded Warbler Kentucky Warbler Yellow-billed Cuckoo Wood Thrush Louisiana Waterthrush Acadian Flycatcher Eastern Wood-pewee Yellow-throated Vireo Yellow-throated Warbler Blue-gray Gnatcatcher Summer Tanager Red-eyed Vireo American Redstart Broad-winged Hawk Pileated Woodpecker Cooper’s Hawk White-breasted Nuthatch
PRIORITY SPECIES Target:Landscapes That Sustain Populations Of Priority Species At Prescribed Levels Forest patches should be of sufficient size to support source populations. Swainson’s Warbler Cerulean Warbler Swallow-tailed Kite Prothonotary Warbler Northern Parula Hooded Warbler Kentucky Warbler Yellow-billed Cuckoo Wood Thrush Louisiana Waterthrush Acadian Flycatcher Eastern Wood-pewee Yellow-throated Vireo Yellow-throated Warbler Blue-gray Gnatcatcher Summer Tanager Red-eyed Vireo American Redstart Broad-winged Hawk Pileated Woodpecker Cooper’s Hawk White-breasted Nuthatch Patch Size Model: A = (N * D) + B A = Area of forest required to support a source population N = Desired number of breeding pairs D = Density of breeding birds (pairs / area) B = Area of a 1-km wide non-hostile buffer around the core (N*D) - How should birds be buffered from predation/parasitism? - What constitutes a source population? - What density do birds occur within the habitat?
Swainson’s Warbler Prothonotary Warbler Northern Parula Hooded Warbler Wood Thrush Acadian Flycatcher Blue-gray Gnatcatcher Red-eyed Vireo American Redstart Cerulean Warbler Kentucky Warbler Summer Tanager Yellow-billed Cuckoo Louisiana Waterthrust Eastern Wood-Pewee Yellow-throated Vireo Yellow-throated Warbler Great Crested Flycatcher Scarlet Tanager White-breasted Nuthatch Swallow-tailed Kite Red-shouldered Hawk Broad-winged Hawk Pileated Woodpecker Cooper’s Hawk Target:Landscapes That Sustain Populations Of Priority Species At Prescribed Levels Ecological Suites Forest patches should be of sufficient size to support source populations. Patch Size Model: A = (N * D) + B A = Area of forest required to support a source population N = Desired number of breeding pairs D = Density of breeding birds (pairs / area) B = Area of a 1-km wide non-hostile buffer around the core (N*D) - How should birds be buffered from predation/parasitism? - What constitutes a source population? - What density do birds occur within the habitat?
Swainson’s Warbler Prothonotary Warbler Northern Parula Hooded Warbler Wood Thrush Acadian Flycatcher Blue-gray Gnatcatcher Red-eyed Vireo American Redstart Cerulean Warbler Kentucky Warbler Summer Tanager Yellow-billed Cuckoo Louisiana Waterthrust Eastern Wood-Pewee Yellow-throated Vireo Yellow-throated Warbler Great Crested Flycatcher Scarlet Tanager White-breasted Nuthatch Swallow-tailed Kite Red-shouldered Hawk Broad-winged Hawk Pileated Woodpecker Cooper’s Hawk Target:Landscapes That Sustain Populations Of Priority Species At Prescribed Levels Ecological Suites Source Population Habitat Requirements Forest Blocks ≥ 10,000ac 500 Pairs Forest Blocks ≥ 20,000ac 500 Pairs Forest Blocks ≥ 100,000ac ~80 Pairs
MAV Ecoregional Habitat Characterization Forest Breeding Birds
MAV Ecoregional Habitat Characterization Forest Breeding Birds Forest Core
Assessment of Landscape Conditions Bottomland Forest Patch Size Number 5-2,500 ac 38,047 2,500-10,000 ac 159 10,000-20,000 ac 55 20,000-100,000 ac 37 >100,000 ac 6 BLH Forest based on 1992 Thematic Mapper satellite Imagery. Patch size values from Twedt and Loesch 1999. MAV Ecoregional Habitat Characterization Forest Breeding Birds
Assessment of Landscape Conditions Bottomland Forest Patch Size Number 5-2,500 ac 38,047 2,500-10,000 ac 159 10,000-20,000 ac 55 20,000-100,000 ac 37 >100,000 ac 6 Predation & Brood Parasitism BLH Forest based on 1992 Thematic Mapper satellite Imagery. Patch size values from Twedt and Loesch 1999. MAV Ecoregional Habitat Characterization Forest Breeding Birds 99% of Forest Fragments Unable to Sustain Source Populations of Species of Concern
MAV Ecoregional Habitat Characterization Forest Breeding Birds Source Population Objectives
Swainson’s Warbler Prothonotary Warbler Northern Parula Hooded Warbler Wood Thrush Acadian Flycatcher Blue-gray Gnatcatcher Red-eyed Vireo American Redstart State 10K 20K 100K 9 0 2 19 14 6 1 11 1 1 15 6 1 1 3 0 0 7 2 0 1 Arkansas Illinois Kentucky Louisiana Mississippi Missouri Tennessee Totals Cerulean Warbler Kentucky Warbler Summer Tanager Yellow-billed Cuckoo Louisiana Waterthrust Eastern Wood-Pewee Yellow-throated Vireo Yellow-throated Warbler Great Crested Flycatcher Scarlet Tanager White-breasted Nuthatch 51 36 13 Swallow-tailed Kite Red-shouldered Hawk Broad-winged Hawk Pileated Woodpecker Cooper’s Hawk Source Population Objectives
Landscapes That Sustain Populations Of Priority Species At Prescribed Levels WHAT WHERE WHEN HOW MUCH HOW MUCH MORE Source Population Objectives Science & Technology Conservation Programs Improving the Biological Efficiency and Effectiveness of our Conservation Actions
WHAT WHERE WHEN HOW MUCH HOW MUCH MORE Source Population Objectives Science & Technology Conservation Programs Federal State Private RESTORATION PROTECTION MANAGEMENT Improving the Biological Efficiency and Effectiveness of our Conservation Actions
Habitat Improving the Biological Efficiency and Effectiveness of Conservation Actions: RESTORATION Use Science and Technology to Development Restoration Decision Support Models Natural Flood Storage Water-Quality
MAV Forest Breeding Bird Reforestation Decision Support Model Restoration DSM Forest Blocks 40,000ha Forest Blocks 4,000ha Forest Blocks 8,000ha Swainson’s Warbler Prothonotary Warbler Hooded Warbler Wood Thrush Acadian Flycatcher Swallow-tailed Kite Red-shouldered Hawk Broad-winged Hawk Pileated Woodpecker Cooper’s Hawk Cerulean Warbler Kentucky Warbler Summer Tanager Yellow-billed Cuckoo Eastern Wood-Pewee
Reforestation Decision Support Model for Forest Breeding Birds
State Wildlife Management AreasNational Wildlife Refuges Reforestation Decision Support Model for Forest Breeding Birds Top 10% Top 20% Top 30% Top 40% Top 50%
Using Decision Support Models to Optimize Biological Efficiency 50 40 30 % Gain in Core Habitat 20 10 0 10 20 30 40 50 60 70 80 90 100 Highest Priority Lowest Priority Reforestation Priority
Using Decision Support Models to Optimize Biological Efficiency Core established in top 10% priorities Core established in top 50% priorities Core established randomly ■ ■ ■ ■ ■ ■ ■ ■ ■ ■ 50 40 30 % Gain in Core Habitat Relationship between core habitat and reforestation priority percentiles when 1.5 million acres are randomly restored. 20 10 0 10 20 30 40 50 60 70 80 90 100 Highest Priority Lowest Priority Reforestation Priority
REFORESTATION PRIORITY BANDS % CORE GAIN (w/ equal reforested area) WRP POINT VALUES Coordinated, Partner-driven Delivery Top 10 47.38% 400 20 14.01% 120 Arkansas Kentucky Ducks Unlimited 30 11.09% 95 Tennessee Missouri 40 7.83% 70 Mississippi Oklahoma Louisiana 50 5.36% 50 The Conservation Fund 60 4.52% 40 70 3.80% 35 80 3.08% 30 90 2.53% 25 100 percentile 2.45% 20 The Nature Conservancy Texas US Fish & Wildlife Wildlife Mgt Institute US Geological Survey US Forest Service FWS Refuges State WMAs Wetland Reserve Program DU MARSH Program FWS Partners for Wildlife NAWCA Carbon Sequestration
National Wildlife Refuge State Wildlife Mgt Area Wetland Reserve Program Ducks Unlimited Easement Assessing Conservation Status - Protection
100 UNPROTECTED 2,358 18 48 3,475 1,645 240 185 7,969 Total Acres X 1000 PROTECTED AR IL KY LA MS MO TN MAV 320 >.1 2 326 10 30 1,916 1,227 PVT EASEMENT STATE FEDERAL Conservation Status of the Forest Breeding Bird Landscape EXTANT FOREST Percent 0 100 Percent CORE 0
National Wildlife Refuge State Wildlife Mgt Area Wetland Reserve Program Ducks Unlimited Easement Improving the Biological Efficiency and Effectiveness of Conservation Actions: PROTECTION • “Forest Protection” • Decision Support Model • Protect Remaining Core? • Protect Forest Buffer? • Protect Extant Forest in Close Proximity to Core?
Forest Inventory Analysis (FIA) Forest Management Tracking System Assessing Conservation Status - Management ?
Realizing the Expectations and Challenges of Joint Venture Implementation Science & Technology Conservation Programs Swainson’s Warbler Prothonotary Warbler Hooded Warbler Wood Thrush Acadian Flycatcher Patch Size Model: A = (N * D) + B A = Area of forest required to support a source population N = Desired number of breeding pairs D = Density of breeding birds (pairs / area) B = Area of a 1-km wide forested buffer around the core (N*D) Source Population Objectives State 10K 20K 100K 9 0 2 19 14 6 1 11 1 1 15 6 1 1 3 0 0 7 2 0 1 Arkansas Illinois Kentucky Louisiana Mississippi Missouri Tennessee Totals 51 36 13 Efficient Effective
Realizing the Expectations and Challenges of Joint Venture Implementation Conservation Programs WHAT WHERE Efficient Effective WHEN HOW MUCH HOW MUCH MORE
Habitat Monitoring Databases Waterfowl Shorebirds Songbirds Water Mgmt Units -Spatial locations -Tabular attributes Water Mgmt Units -Spatial locations -Tabular attributes • Forest Mgmt Units • Mgmt w/in units • Cruz data • Demonic disturbance • Fire • Ice • Storm • Satellite Imagery • Performance • Compliance • Reforestation • Spatial locations • Tabular attributes Mgmt w/in Units -Tracking Mgmt -Monitoring Plant Response (% cover) Productivity (lbs/ac)
The LMVJV Reforestation Tracking System • Reforestation: the re-establishment of a forested land use on areas that were previously converted from a forested to non-forested land use • e-RTS • Internet-accessible data entry and query application • Data is “housed” in a relational database • Designed to serve as a central repository for reforestation data • Managed and served by the LMV Joint Venture Office as a service to Joint Venture partners
Why an LMVJV Reforestation Tracking System? • Reforestation is a common LMVJV partner conservation action that is inherently spatial and temporal • Document the collective contributions of multiple programs / organizations to meet landscape goals and objectives • To assess partnership progress and inform adaptive approach to conservation, need to know • Where was it done? • How much was done? • How was it done? • Where are the high priority places? • e-RTS: Example of a value-added service required to achieve NABCI goal: “regionally based, biologically driven, landscape-oriented” conservation Spring 2004 MBM Notebook: Revised LMVJV Business Model, pg 4
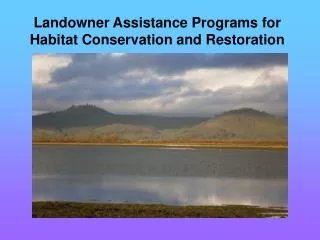
Partner Landholdings Why an LMVJV Reforestation Tracking System? Assess and inform the collective contributions to LMVJV landscape goals both spatially and temporally
Forest Core Forest Why an LMVJV Reforestation Tracking System? Assess and inform the protection and management of “core” habitat for area-sensitive wildlife
Higher Lower Reforestation Priorities Forest Property Boundaries Why an LMVJV Reforestation Tracking System? Assess and inform the restoration of the most environmentally sensitive portions of the landscape
Why this kind of Reforestation Tracking System? e-RTS takes advantage of two information technologies to help track a common conservation practice comprehensively and efficiently • The relational database design • The Internet • A relational database is good for • Efficient storage of data • Efficient access to “answers” that can be gleaned from specific questions (e. g., queries) • Efficient data maintenance • Internet applications for data entry and access are good for • Efficient entry of data • Maintenance of data quality during data entry • Maintenance of data standards • User-friendly data access
Why this kind of Reforestation Tracking System? Beneficial Results • Comprehensive data set: Foresters chose the set of tracked parameters • Common set of parameters: Foresters chose data standards • Improve landscape planning, assessment, and evaluative research • Centralized: Reduce individual organization’s costs for hardware, software and personnel to design, build, and maintain system • Efficient / Convenient: Reduce data entry time and speed access to data summaries • Reduce program costs • Increase use of data for land management decisions
Data entry via e-RTS web interface • Data entry system • Guides user through data entry process • Prevents common data entry errors • Increases data entry speed • Insures standardization of data • Improves data quality • Facilitates data updates • Improves data accessibility