Download
1 / 19
190 likes | 212 Vues
This presentation provides the latest information on greenhouse gas (GHG) trends and projections for Annex I Parties. It includes data sources, GHG trends from 1990-2004 and 2000-2004, sectoral changes in GHG emissions, and the decoupling of GHG emissions from economic growth. The presentation also highlights policies and measures driving GHG trends.

E N D
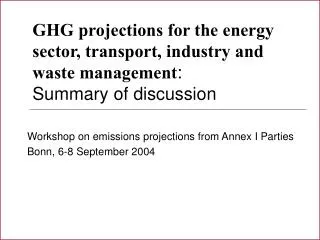
2nd session of AWG Nairobi, Kenya 7 November 2006 GHG trends and projectionsfor Annex I Parties by Sergey KONONOVSecretariat of the United NationsFramework Convention on Climate Change (UNFCCC)Bonn, Germany
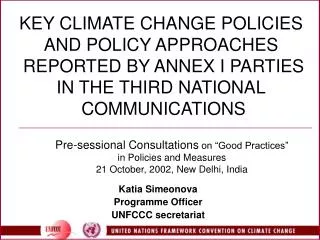
Mandate The workshop addresses (FCCC/KP/AWG/2006/2): (a) Work by Annex I Parties on the scientific basis for determining their further commitments, including on scenarios for the stabilization of atmospheric concentrations of greenhouse gases and on the implications of these scenarios; (b) Emission trends for Annex I Parties, the mitigation potential of policies and technologies in different national circumstances, including experience gained so far, and the costs and benefits of emission reductions. • In line with the discussion area outlined, this presentation will: • Provide latest information on emission trends in Annex I Parties • Present preliminary data on GHG projections for Annex I Parties • The information is as officially submitted by Parties => structured as …
Presentation outline Data sources: – 2006 submissions of national GHG inventories of Annex I Parties (available on unfccc.int), – see also FCCC/SBI/2006/26 Part 1: GHG trends 1990–2004 Data sources: – 4th national communications (NC4) and reports on demonstrable progress (RDP) of Annex I Parties (available on unfccc.int) Part 2: GHG projections to 2010–2020 Part 3: Data sheets for reference Same sources
1a. GHG trends (all AI Parties)1990–2004 / 2000–2004 Trends 1990 – 2004 Trends 2000 – 2004 +11.0 –3.3 –36.8 1) All Annex I Parties: –3.3% (below 1990 level) 2) EITs: –36.8% / non-EITs: +11.0% 3) Since 2000, GHG emissions increased slightly, in total by 2.4% Note: The emissions are without LULUCF; data with LULUCF are available in the Appendices
1b. GHG trends (KP Parties)1990–2004 / 2000–2004 Trends 1990 – 2004 Trends 2000 – 2004 +3.7 –15.3 –37.0 1) All Annex I Parties: –15.3% (below 1990 level; below –5%) 2) EITs: –37.0% / non-EITs: +3.7% 3) Since 2000, GHG emissions increased slightly, in total by 2.9% Note: The emissions are without LULUCF; data with LULUCF are available in the Appendices
2a. Shares in GHG total without LULUCF (all AI Parties) 2004 data: increased shares of non-EIT Parties 1990 data (special base years for 5 EITs)
2b. GHG trends 1990–2004(without LULUCF) • Changes vary greatly: from –60.4% to +72.6% • In 22 Parties the emissions decreased; in 19 – increased
2c. GHG trends 1990–2004(with LULUCF) • Changes vary greatly: from –160.5% to +62.2% • In 18 Parties the emissions decreased; in 16 – increased • For some Parties (e.g., Australia and Canada), changes “with LULUCF” differ considerably from changes “without LULUCF”
3a. Sectoral changes in GHG emissions (all AI Parties) • Sizable GHG reductions in industry, agriculture, waste • Increase in GHG removals by LULUCF (by 24.8 per cent) • Modest decrease for energy, only –0.4%: - increases in energy industries and, in particular, transport … =>
3b. Transport: challenge for GHG mitigation Increase by 52.0% Increase by 23.9% Increase by 3.4% 1) Continuing GHG growth in transport - up to 23.9% in 2004 2) Upward trend for both domestic and international transportation Note: The emissions from transport do not include emissions in the Russian Federation because these emissions were reported in 2006 with notation keys only
Change1990-2000 (%) Change2000-2004 (%) Change1990-2004 (%) GHG emissions (All Annex I Parties) -5.6 2.4 -3.3 GDP (All Annex I Parties) 22.2 9.9 34.2 GHG/GDP (All Annex I Parties) -22.7 -6.8 -28.0 Population (All Annex I Parties) 5.1 1.5 6.7 GHG/capita (All Annex I Parties) -10.2 0.8 -9.4 4. GHG emission and GDP:decoupling in process 1) GHG decrease from 1990 to 2004 has been combined with economic growth 2) “Decoupling” of emissions from economic growth continues after 2000 Note: GDP and population data are from the World Bank; emissions data are from Parties’ submissions under the UNFCCC
Implemented/adopted P&Ms: Energy-related: promoting energy efficiency and renewable energy, fuel switching to natural gas Industrial processes: reductions in N2O from acid production, measures on fluorinated gases) Waste: waste minimization and recycling, controlling emissions from landfills, waste incineration LULUCF: sustainable forest management, afforestation and reforestation Additional P&Ms: Emission trading at national and international levels Strengthening existing policies, e.g. on renewables / energy efficiency New measures in transport, e.g. promoting biofuels Promoting new technologies, such as carbon capture and storage Use of flexibility mechanisms under the Kyoto Protocol Additional measures in LULUCF 5. Policies and measures: drivers behind GHG trends • Policy background: economic growth, structural changes in economies, changes in population => important drivers behind emission trends • Policy development / strengthening in process (existing => add. measures) • Policy packages evaluated by Parties => projection scenarios => … Note: the type and number of policies and measures depend much on specific national circumstances of a Party; the approach to projecting policy impacts also differs from Party to Party
6. GHG projections: tool to help the policy process • Projections submitted in 2005–2006 in NC4s and RDPs • Projections cover 39 Annex I Parties: • 30 Parties: new projections from NC4 and RDP • 8 Parties: older (NC3) projections • 3 Parties: no projections data • Projection period: mostly to 2010 (not always 2020…) • Scenarios: • “with measures” (all 38 Parties): implemented and adopted measures • “with additional measures” (only 23 Parties): planned measures • notdiscussed: “without measures” (reported by few Parties) • GHG = sum of CO2, CH4, N2O, HFCs, PFCs, SF6 • Limited info => not covered yet in the current data • LULUCF projections (only a few Parties) • KP mechanisms and RMUs from LULUCF
6a. GHG projections (WM): All Annex I Parties Note: Projections data for individual Parties are available in the appendices
6b. GHG projections (WM): Annex I KP Parties only Note: Projections data for individual Parties are available in the appendices
6c. GHG projections: Impact of add. measures Caveat: WAM not consistent with WM (23 Parties only, not 38) => additional data or assumptions needed… ? Note: Projections data for individual Parties are available in the appendices
Summary The following has been presented based on the latest available information: • Trends in GHG emissions from 1990 to 2004: • without LULUCF • with LULUCF • GHG projections (without LULUCF) for the period up to 2010 and, less accurately, 2020: • scenario “with measures” for 38 Parties • scenario “with additional measures” for 23 Parties (limited info) • Additional numerical information is available in: • FCCC/SBI/2006/26 • appendices to this presentation (more detailed data on GHG trends and projections)